
SXR8 vs VUAA: S&P 500 ETF Fee Analysis
Educational content from an independent European ETF investor — not regulated financial advice.
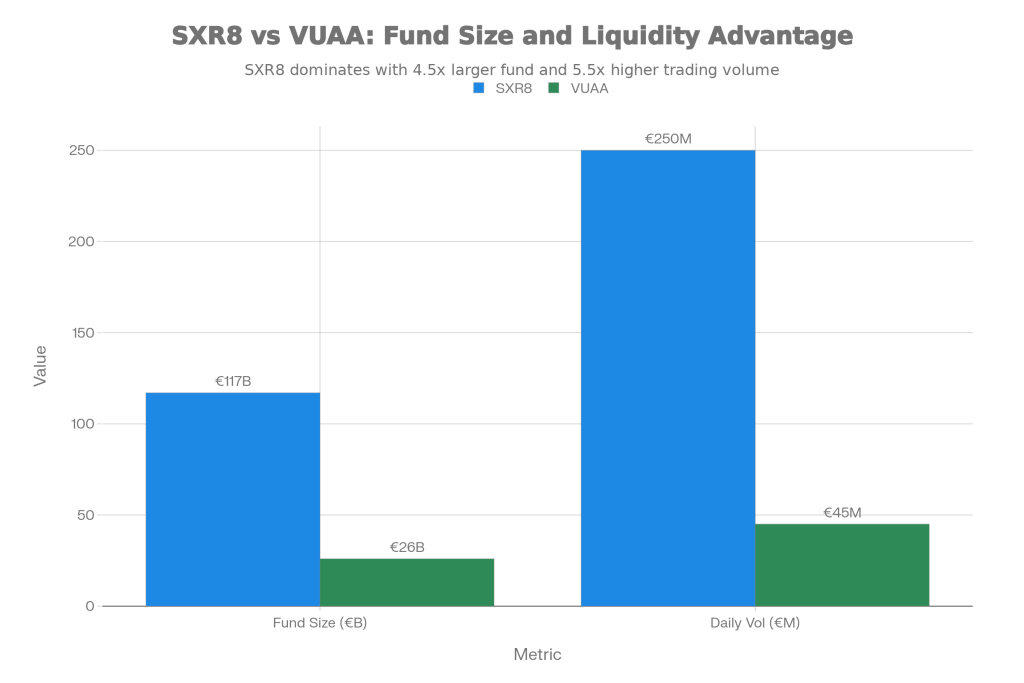
European investors comparing SXR8 and VUAA face identical 0.07% expense ratios. Both Ireland-domiciled UCITS ETFs track the S&P 500. Moreover, both use accumulating structures. However, the surface-level similarity masks meaningful cost differences. Comprehensive analysis reveals these gaps. Hidden expenses include tracking difference, bid-ask spreads, and securities lending revenue. Consequently, actual ownership costs diverge from the headline TER. Fund size disparities also matter. For example, SXR8 holds €117 billion versus VUAA’s €26 billion. These figures translate to liquidity advantages affecting transaction costs. Share price differences dramatically impact monthly investing efficiency. Therefore, understanding total cost of ownership determines optimal selection. Marketing materials alone fall short. For wider all-world and single-country context, see our VWCE vs all-world ETF comparison hub. Additionally, step back to the European ETF investing beginner roadmap before locking in a single S&P 500 allocation.
Comparing funds is step one — the Masterclass turns it into a complete plan — fund choice, broker setup, YOUR country’s taxes and the first purchase, in 55 text lessons.
I keep full ticker profiles in my SXR8 factsheet and VUAA factsheet.
Run the TER through the TER cost analyzer to see the lifetime cost of a fee difference.
Understanding Total Cost of Ownership
The TER Myth
Total Expense Ratio represents only one component of actual costs. Both SXR8 and VUAA advertise a 0.07% annual TER. This figure covers fund management and administrative expenses. Notably, the headline figure attracts investors through competitive positioning. However, TER excludes several significant cost categories. These categories affect real returns. Trading costs, tracking differences, and implicit expenses stay hidden from casual analysis. Therefore, comprehensive cost evaluation requires examining multiple factors. Stated expense ratios tell only part of the story. Crucially, definitions and live TER, AUM and tracking data for both funds appear on justETF. Most European retail investors triangulate this data source against fund factsheets.
Methodology: every shortlist on this page applies our fund comparison criteria.
Marketing emphasizes TER while downplaying total ownership costs. Fund providers compete aggressively on expense ratios because of their visibility. Consequently, investors naturally gravitate toward lower advertised costs. Many skip deeper investigation. The identical 0.07% TER between SXR8 and VUAA suggests equivalent economics. However, this superficial equality masks operational differences. These differences create meaningful long-term cost divergence. By contrast, sophisticated investors analyze total cost of ownership beyond marketing metrics.
Real-world costs include explicit and implicit expenses. Explicit costs like TER appear clearly in fund documentation. By contrast, implicit costs such as bid-ask spreads and tracking error stay hidden from surface-level review. Securities lending revenue potentially offsets some expenses. Therefore, the net effect of all cost components determines true ownership expense. Investors must calculate comprehensive costs. Otherwise, accurate comparison between seemingly identical funds becomes impossible.
Tracking Difference Analysis
SXR8 demonstrates superior tracking efficiency at 4.2 basis points. The fund’s five-year average tracking difference shows consistent outperformance versus stated TER. Importantly, this operational excellence stems from BlackRock’s scale advantages. Sophisticated portfolio management also helps. Larger asset bases enable more efficient index replication through economies of scale. Consequently, the tracking advantage compounds meaningfully over decades. Substantial wealth differences result.
VUAA exhibits 5.1 basis points tracking difference. The marginally wider gap versus SXR8 reflects newer vintage and smaller asset base. Notably, Vanguard employs full physical replication. By contrast, iShares uses optimized sampling. This methodological difference creates minor operational cost variations. The 0.9 basis point disadvantage stays small but measurable. However, over 30 years on €100,000, this differential accumulates to roughly €2,700 in foregone returns.
Tracking difference reveals operational quality. Funds delivering returns below index performance net of TER demonstrate inferior management. By contrast, positive tracking differences indicate efficient operations. They also signal successful cost controls. SXR8’s tighter tracking suggests superior execution quality. Furthermore, securities lending revenue and operational efficiencies enable outperformance versus headline costs. Crucially, investors should prioritize tracking quality over stated expense ratios when comparing ETFs. Cross-check independent multi-year tracking difference and risk metrics for SXR8 and VUAA on Morningstar UK. This source decomposes total return versus the S&P 500 net return index after costs.

Liquidity and Trading Costs
Bid-Ask Spread Impact
SXR8 maintains 1.5 basis point typical spreads. The massive €117 billion fund size attracts substantial market maker attention. Moreover, very high trading volumes ensure deep order books. Competitive pricing follows. Large institutional flows provide continuous liquidity. Tight markets result. For example, a €10,000 purchase carries spread costs of roughly €1.50. Consequently, the minimal friction benefits all investors regardless of position size.
VUAA exhibits 2.0 basis point spreads. The smaller €26 billion asset base reduces market maker interest marginally. However, high trading volumes still create adequate liquidity. Spreads widen modestly versus SXR8. This reflects relative size differences. On a €10,000 investment, spread costs reach €2.00. Notably, the 33% higher implicit cost compounds over multiple transactions throughout investing lifetimes.
Spread differences matter most for frequent traders. Buy-and-hold investors making occasional large purchases face minimal total spread costs. By contrast, monthly investors accumulating positions over decades execute hundreds of transactions. For example, the 0.5 basis point spread advantage for SXR8 saves €50 annually on a €100,000 portfolio turned over once. Additionally, active rebalancers and tactical allocators benefit substantially from SXR8’s superior liquidity. Therefore, trading frequency determines spread cost importance for individual circumstances.
Fund Size Advantages
SXR8’s €117 billion assets provide multiple operational benefits. Massive scale enables sophisticated portfolio management techniques. Smaller funds lack access to these techniques. Moreover, index rebalancing and corporate actions process more efficiently. Fixed costs spread across a larger asset base. Per-unit expenses drop as a result. Notably, securities lending operations achieve better terms through institutional counterparties. Consequently, the cumulative advantages manifest in superior tracking differences and lower implicit costs.
Market maker support intensifies with fund size. Major financial institutions dedicate resources to high-volume securities. For example, SXR8’s €250 million daily trading volume ensures continuous two-sided markets. Multiple market makers compete. Pricing tension follows, benefiting investors. Importantly, large institutional orders execute efficiently without meaningful market impact. The liquidity premium represents real economic value for all shareholders.
VUAA’s smaller size creates minor disadvantages. The €26 billion asset base stays substantial by industry standards. Adequate liquidity serves most retail investor needs comfortably. Furthermore, market makers provide reasonable pricing despite lower volumes versus SXR8. These disadvantages prove negligible for small investors making infrequent trades. However, large institutions and frequent traders face measurable efficiency costs from reduced scale.
Share Price Considerations
Monthly Investing Efficiency
VUAA’s €113 share price enables efficient capital deployment. Monthly €500 contributions purchase 4.42 shares. Only €32 remains uninvested. Consequently, low cash drag maximizes equity market exposure continuously. Small investors building positions gradually benefit substantially from accessible pricing. Additionally, psychological comfort comes from purchasing multiple shares regularly. The share price advantage proves decisive for monthly investors contributing under €1,000.
SXR8’s €632 share price creates accessibility challenges. The same €500 monthly investment purchases only 0.79 shares. Roughly €121 remains uninvested awaiting next month’s contribution. Over 12 months, the average uninvested balance of €60 costs €6 in foregone returns. This assumes 10% annual equity gains. Consequently, the opportunity cost compounds over decades of accumulation. Fractional share availability eliminates this concern. However, many European brokers restrict whole-share trading.
Fractional Share Availability
Fractional shares eliminate price-based disadvantages completely. Interactive Brokers, DEGIRO, and Trade Republic support fractional purchases. Consequently, investors deploy capital fully regardless of share price. For example, a €500 investment purchases exactly €500 worth of either fund. Share price accessibility becomes irrelevant under fractional regimes. Therefore, European investors should verify broker capabilities. Otherwise, assumptions about share price relevance may mislead.
Traditional brokers often require whole shares. Many European platforms including traditional banks restrict fractional trading. Investors must purchase integer share quantities only. Consequently, this limitation significantly advantages lower-priced funds for monthly accumulators. Cash drag from uninvested amounts measurably reduces returns. Notably, the constraint particularly affects small investors. They are most sensitive to efficiency losses. Therefore, broker selection determines whether share price considerations matter practically.
Securities Lending Revenue
Revenue Generation
SXR8 generates 0.8 basis points annual securities lending revenue. The fund lends shares to short sellers earning fees. Importantly, BlackRock maintains extensive counterparty relationships. These facilitate lending operations. Large fund size enables more efficient lending programs. Consequently, this revenue partially offsets operational costs. Tracking difference improves as a result. The 0.8 basis points reduces net total cost from 12.7 to 11.9 basis points annually.
VUAA produces 0.6 basis points lending revenue. Vanguard’s investor-owned structure returns lending proceeds to fund shareholders. However, the smaller asset base and newer vintage reduce lending efficiency marginally versus SXR8. Counterparty relationships develop over time as funds mature. The 0.6 basis points helps offset costs. Nevertheless, it trails SXR8’s achievement. Both funds engage in securities lending responsibly with appropriate safeguards.
Securities lending carries minimal risk properly managed. Borrowers post collateral exceeding loaned share values. Moreover, daily mark-to-market ensures adequate coverage continuously. Regulatory oversight mandates transparent practices and risk controls. Additionally, both BlackRock and Vanguard demonstrate strong operational track records. Consequently, the incremental revenue enhances shareholder returns without meaningful risk elevation. Conservative investors can verify lending policies through fund documentation.
Performance Comparison
Historical Returns
Performance converges given identical underlying holdings. Both funds track the S&P 500 through physical replication. The same 500 stocks weighted identically produce near-identical gross returns. However, minor differences stem from operational efficiency variations. For example, SXR8’s tighter tracking delivers marginally superior returns historically. Despite this, the differences prove too small for statistical significance. Therefore, investors should expect equivalent performance over long holding periods.
Cost advantages compound over decades. SXR8’s 1.6 basis point total cost advantage seems trivial annually. For instance, on €100,000 invested, the differential totals €16 per year. However, over 30 years at 8% returns, this seemingly minor edge compounds to roughly €13,000 additional wealth. The mathematics of compounding magnifies small differences dramatically. Consequently, long-term investors should optimize every basis point. Exponential effects over time justify the focus.
See the 30-year compounded value in our ETF compound calculator.
Risk Characteristics
Volatility profiles match identically. Both funds provide pure S&P 500 equity exposure. Annual volatility measures roughly 18-20% for both options. Moreover, maximum drawdowns during market crashes affect funds equally. The identical holdings create indistinguishable risk profiles. Therefore, risk considerations cannot differentiate between these options. Investors should adjust total equity allocation rather than choose between SXR8 and VUAA for risk management.
Strategic Selection Framework
When to Choose SXR8
SXR8 Advantages Best for Large Investors
- Superior liquidity: €250M daily volume
- Tighter spreads: 1.5 bps vs 2.0 bps
- Better tracking: 4.2 bps vs 5.1 bps
- Lower total cost: 11.9 bps vs 13.5 bps
- Massive scale: €117B fund size
- Longer track record: Since 2010
Best For:
- Investors making large lump-sum purchases
- Portfolios exceeding €100,000
- Frequent traders and rebalancers
- Institutional investors
- Cost optimization purists
- Investors with fractional share access
SXR8 suits cost-conscious optimizers — investors who treat the S&P 500 sleeve as one leg of a broader portfolio. For example, many readers combine a US sleeve with an all-world wrapper. Our VWCE comparison hub unpacks the trade-offs of doing so. The 1.6 basis point total cost advantage compounds meaningfully over decades. Moreover, superior tracking efficiency delivers incremental returns consistently. Tight spreads also benefit frequent traders by minimizing transaction friction. Additionally, massive fund size ensures perpetual viability. Continued scale benefits follow. Therefore, sophisticated investors prioritizing efficiency should default to SXR8 absent specific reasons favoring alternatives.
Large portfolio investors require SXR8’s liquidity. Positions exceeding €100,000 benefit materially from deep markets and tight spreads. Importantly, institutional-grade daily volumes enable efficient large-scale positioning. Market impact stays minimal even for substantial orders. Consequently, the liquidity premium provides real economic value. This justifies SXR8 selection. By contrast, high-net-worth individuals and institutions should strongly favor SXR8’s superior trading characteristics.
When to Choose VUAA
VUAA Advantages Best for Monthly DCA
- Accessible pricing: €113 vs €632 per share
- Lower cash drag: €32 vs €121 uninvested
- Full replication: Complete index coverage
- Vanguard ownership: Investor-aligned structure
- Adequate liquidity: €45M daily volume
- Competitive costs: 13.5 bps total
Best For:
- Monthly investors contributing €250-€1,000
- Dollar-cost averaging strategies
- Investors without fractional shares
- Vanguard ecosystem loyalists
- Smaller portfolios under €50,000
- Infrequent traders buying and holding
VUAA optimizes capital efficiency for monthly investors. The €113 share price enables purchasing 2-4x more shares than SXR8 monthly. Consequently, minimal cash drag ensures nearly complete equity market exposure continuously. Additionally, psychological satisfaction from buying multiple shares regularly matters for some investors. Monthly contributions of €300-€800 deploy optimally with VUAA. Therefore, investors without fractional share access should strongly consider VUAA’s accessibility advantages.
Vanguard loyalists prefer ecosystem consistency. Some investors philosophically favor Vanguard’s investor-owned structure. Notably, the mutual ownership model aligns incentives perfectly with shareholders. Full physical replication provides transparency and simplicity. Moreover, Vanguard’s reputation for cost discipline and investor advocacy resonates with values-driven allocators. Consequently, these philosophical preferences justify VUAA selection despite marginal cost disadvantages.
Practical Implementation
Broker Considerations
DEGIRO lists both funds on commission-free Core Selection. European investors using DEGIRO access either ETF without trading fees. Consequently, transaction cost differentials disappear for DEGIRO users. The Core Selection inclusion makes both funds attractive for regular investing. However, spread differences remain. Commission elimination only partially levels the playing field. Therefore, DEGIRO users should focus on share price accessibility and total cost differences primarily.
For the full side-by-side breakdown across 10 EU brokers, use the live broker-fee math.
Interactive Brokers supports fractional shares. IBKR users can ignore share price considerations entirely. Both funds trade at €1-3 per transaction regardless of order size. Moreover, the platform’s 0.002% FX conversion enables efficient currency management. Consequently, fractional share capability makes SXR8’s higher price irrelevant. Therefore, IBKR users should select SXR8 for superior tracking and lower total costs exclusively.
Traditional brokers may restrict one fund. Some European platforms offer limited ETF selections. Availability determines selection when only one fund trades. Therefore, verify broker offerings before optimizing between these options. Fund availability matters more than marginal efficiency differences. By contrast, investors should select brokers supporting both funds for maximum flexibility and optimization opportunities.
Tax Implications
Ireland domicile optimizes tax treatment identically. Both funds benefit from Ireland’s 15% US dividend withholding treaty. Importantly, the official issuer factsheets document the Ireland-domiciled UCITS structure — iShares UK for SXR8 and Vanguard UK for VUAA. Furthermore, EU law regulates the UCITS framework itself, overseen by ESMA. Consequently, this structural advantage saves 15 percentage points versus US-domiciled alternatives. Accumulating structures defer taxation until share sale. Notably, since 1 January 2026 Belgian investors pay 10% capital gains tax on equity ETF gains above a €10,000 annual exemption. The identical tax profiles still eliminate tax considerations as differentiating factors. Geographic arbitrage benefits apply equally to both options.
Accumulating funds compound tax-efficiently. Automatic dividend reinvestment avoids taxable distribution events. Consequently, this structure enables larger sums to compound tax-free until final sale. The advantage proves substantial over multi-decade holding periods. Moreover, both SXR8 and VUAA provide equivalent tax efficiency. Therefore, tax optimization cannot differentiate between these funds given structural similarities. Focus cost and accessibility analysis rather than tax considerations.
Methodology and Data Sources
How the cost comparison was built
Total cost of ownership combines four measurable components for each fund. The headline TER (0.07% for both SXR8 and VUAA) comes from the issuers’ own KIIDs and factsheets. We cross-check these against justETF profile pages. Tracking difference uses the trailing five-year average gap between fund NAV total return and the S&P 500 Net Total Return index. Morningstar UK provides this data. Bid-ask spreads reflect typical retail screen spreads observed during European trading hours on Xetra and the London Stock Exchange. Additionally, securities lending revenue figures come from the most recent annual reports of each fund.
Numbers are recomputed each editorial review cycle. The TER, AUM, spread and tracking inputs all drift over time. Funds grow and market structure shifts. Importantly, I do not invent or extrapolate. If a primary source has not yet been updated, the previous cycle’s number remains. Furthermore, the editorial workflow clearly flags such cases. The methodology mirrors the structured Boglehead-style approach explained on the Bogleheads wiki. However, we apply it to European UCITS realities rather than US-domiciled funds.
What this analysis is not
This is not regulated financial advice. I am an independent European investor, not an FCA-authorised adviser. Nothing on this page constitutes a personalised recommendation. Notably, tax outcomes vary materially by country of tax residence. Please verify with a qualified local accountant before acting. EU level rules set UCITS investor protections, and national regulators supervise them. For example, BaFin oversees this in Germany. Additionally, ESMA coordinates cross-border ETF distribution.
Common Questions
Does Provider Matter?
BlackRock and Vanguard both demonstrate operational excellence. The world’s two largest asset managers maintain strong track records. BlackRock operates a for-profit structure prioritizing shareholder returns. By contrast, Vanguard’s investor-owned model aligns interests perfectly with fund shareholders. Moreover, both providers exhibit strong fiduciary practices and competitive cost structures. Therefore, provider selection reflects philosophical preferences rather than operational quality differences.
Scale advantages favor BlackRock marginally. The $10+ trillion asset base enables unmatched operational sophistication. Notably, the Aladdin risk management platform provides institutional-grade oversight. However, Vanguard’s $8 trillion in assets stays substantial. Both organizations possess resources exceeding what individual fund management requires. Consequently, operational quality differences prove negligible for practical portfolio outcomes. Furthermore, provider diversification provides minimal benefits given passive strategy overlap.
Should I Switch Funds?
Existing holdings rarely justify switching. Transaction costs including spreads and potential taxes exceed benefits. For example, the 1.6 basis point cost difference requires decades to offset switching expenses. Therefore, investors currently holding either fund should maintain positions. New contributions can flow to the preferred alternative, optimizing prospectively. Avoid unnecessary transactions chasing marginal improvements. Otherwise, portfolio turnover generates costs exceeding efficiency gains from switching.
New investors should optimize from inception. Initial purchase decisions matter most when avoiding future switching costs. Therefore, analyze personal circumstances including investment amounts and broker capabilities. Select the optimal fund based on comprehensive evaluation. Importantly, upfront analysis prevents costly mistakes requiring later correction. Starting correctly proves easier than optimizing existing positions bearing tax and transaction burdens.
How Much Do These Differences Matter?
Small cost differences compound exponentially. The 1.6 basis point total cost advantage seems trivial annually. For example, on €100,000, this differential totals just €16 per year. However, over 30 years at 8% returns, the cumulative difference exceeds €13,000. Notably, compounding mathematics magnifies minor differences dramatically over decades. Therefore, long-term investors should optimize every basis point given exponential wealth effects.
Context determines practical significance. Large portfolios and long time horizons maximize cost optimization importance. By contrast, small investors making occasional purchases face negligible absolute differences. For example, monthly €500 investors might save €50 annually by choosing optimally. The personal significance depends on portfolio size and investment horizon. Consequently, sophisticated investors optimize religiously. Others reasonably prioritize simplicity over marginal efficiency.
Frequently Asked Questions
Is SXR8 or VUAA cheaper for a European investor in 2026?
Both list the same 0.07% headline TER. However, once tracking difference, bid-ask spread and securities lending revenue combine, SXR8 currently runs roughly 1.6 basis points cheaper per year. This holds on a total-cost-of-ownership basis. On a €100,000 position, that comes to roughly €16 per year. Small in isolation, yes. However, it compounds to a four-figure gap across a 30-year holding period.
Which ETF is better for monthly DCA without fractional shares?
VUAA, in most cases. A €113 share price means a €500 monthly contribution buys roughly four whole shares. Only a small cash residue remains. By contrast, SXR8 sits at around €632. The same €500 buys less than one share and leaves a large uninvested balance. However, if your broker supports fractional shares (Interactive Brokers, Trade Republic, DEGIRO’s fractional flow) the share price gap stops mattering. SXR8’s cost edge then wins.
Are SXR8 and VUAA both UCITS and Ireland-domiciled?
Yes. Both funds are UCITS-compliant and domiciled in Ireland. Consequently, European investors get the 15% US dividend withholding rate via the US-Ireland tax treaty. Notably, the UCITS framework itself enjoys EU level supervision by ESMA. National regulators implement it locally.
Does securities lending make these ETFs risky?
In practical terms, no. Both BlackRock (SXR8) and Vanguard (VUAA) over-collateralise loans. Moreover, they mark exposures to market daily and disclose lending policies in their annual reports. The incremental revenue runs roughly 0.6 to 0.8 basis points per year. Small but real, it partially offsets the TER. However, risk only becomes meaningful in extreme counterparty failure scenarios. The collateral framework is explicitly designed to absorb these.
Should I switch from VUAA to SXR8 (or vice versa)?
Rarely worth it. A switch crystallises a taxable event in most jurisdictions. Additionally, you pay round-trip spread and any broker fees. Consequently, a 1.6 basis point annual edge typically takes many years just to repay those switching costs. That figure precedes tax considerations. New contributions can flow to your preferred fund instead.
Where can I verify the live TER, AUM and tracking numbers?
Cross-check the issuer factsheets — iShares UK for SXR8 and Vanguard UK for VUAA — against justETF and Morningstar UK. However, if the issuer and the aggregators disagree, the issuer’s most recent KIID and annual report take precedence.
Does VWCE or a global ETF make SXR8/VUAA redundant?
Partly. A single global all-world UCITS ETF like VWCE already gives you ~60% US equity exposure. Consequently, a separate S&P 500 sleeve is a deliberate overweight to the US rather than diversification. Whether that overweight makes sense is a portfolio-construction question. The VWCE comparison hub covers this in detail.
Q: SXR8 or VUAA – which should I pick?
A: Both give you the same S&P 500 exposure, so I would not agonise over the index itself. SXR8 is the iShares Xetra EUR line (the same underlying fund as CSPX), while VUAA is Vanguard’s equivalent. In practice I decide by broker availability, the currency line I can trade cheaply and whether my broker’s savings plan supports the ticker.
Q: What is SXR8’s TER?
A: Around 0.07% per year at the time of writing – treat that as illustrative and check the issuer factsheet for the current figure before you buy.
SXR8 delivers 1.6 basis points lower total cost (11.9 bps vs 13.5 bps). This comes through superior tracking efficiency, tighter spreads, and enhanced securities lending revenue from a €117B fund size. By contrast, VUAA’s €113 share price enables efficient monthly investing for those without fractional share access. SXR8’s €632 creates substantial cash drag for the same group. Therefore, choose SXR8 for large portfolios, frequent trading, or fractional share capability. Select VUAA for monthly contributions under €1,000 without fractional shares, or Vanguard ecosystem preference. Both provide excellent Ireland-domiciled UCITS S&P 500 exposure. However, the identical 0.07% TER masks meaningful operational differences. Calculate total cost of ownership including tracking difference, spreads, and lending revenue. Crucially, long-term investors should optimize every basis point given compounding effects. Share price accessibility matters critically for monthly investors on whole-share-only brokers.
Put a number on the domicile question: the gap between an Irish and a Luxembourg fund on US dividends is worth roughly fifteen basis points a year — our free ETF withholding tax calculator models that leakage on your own allocation.
Sources and further reading
- justETF — European UCITS ETF screener
- Morningstar UK ETF rankings
- ESMA — European Securities and Markets Authority
- Bogleheads wiki — EU investing
- ETF.com industry data
European UCITS/ETF investor with 11+ years building a global dividend and index portfolio, and founder of Financial Expert Class. I write every guide here from first-hand experience investing across EU brokers and tax regimes — not theory. More about me →