
The FTSE Global All Cap Index tracks large, mid and small company shares across developed and emerging markets. As at 31 August 2026, it held 10,113 stocks in 48 countries, with the US at 61.91% of the index. UK investors mainly meet it through the Vanguard FTSE Global All Cap Index Fund. In addition, since August 2026 they can use a Vanguard UCITS ETF as well.
New to ETFs? Start with the free checklist.
The European ETF Starter Kit: what to check before you buy your first UCITS ETF — domicile, costs, tax and broker set-up.
What the FTSE Global All Cap Index holds
The index is part of FTSE Russell’s Global Equity Index Series. That family of rules also produces the FTSE All-World and FTSE Developed indices. It is market-capitalisation weighted. In other words, each company’s weight reflects the value of its shares that are freely available to investors (free float). So the bigger the company, the bigger its weight. FTSE Russell reviews the index twice a year, in March and September. It has calculated the index since 1 September 2003.
At the end of August 2026 the factsheet split the 10,113 constituents like this:
- Large caps: 1,870 companies, the household names that make up most of the value.
- Mid caps: 2,394 companies.
- Small caps: 5,849 companies. That is more than half the stock count, but only a small slice of the index by value.
That last point is the key to understanding “all cap”. Adding thousands of smaller firms does not transform the portfolio. Instead, it fills in the corner of the market that large-and-mid indices leave out. For example, the top ten holdings still made up 21.63% of the index, with Nvidia alone at 4.37%. They were Nvidia, Apple, Microsoft, Amazon, the two Alphabet share classes, Taiwan Semiconductor Manufacturing, Broadcom, Meta Platforms and Micron Technology.
Country and sector weights
Because the index follows market value, it mirrors the size of the world’s stock markets today. It does not reflect how big each economy is. The US is by far the largest market, and Japan is a distant second.
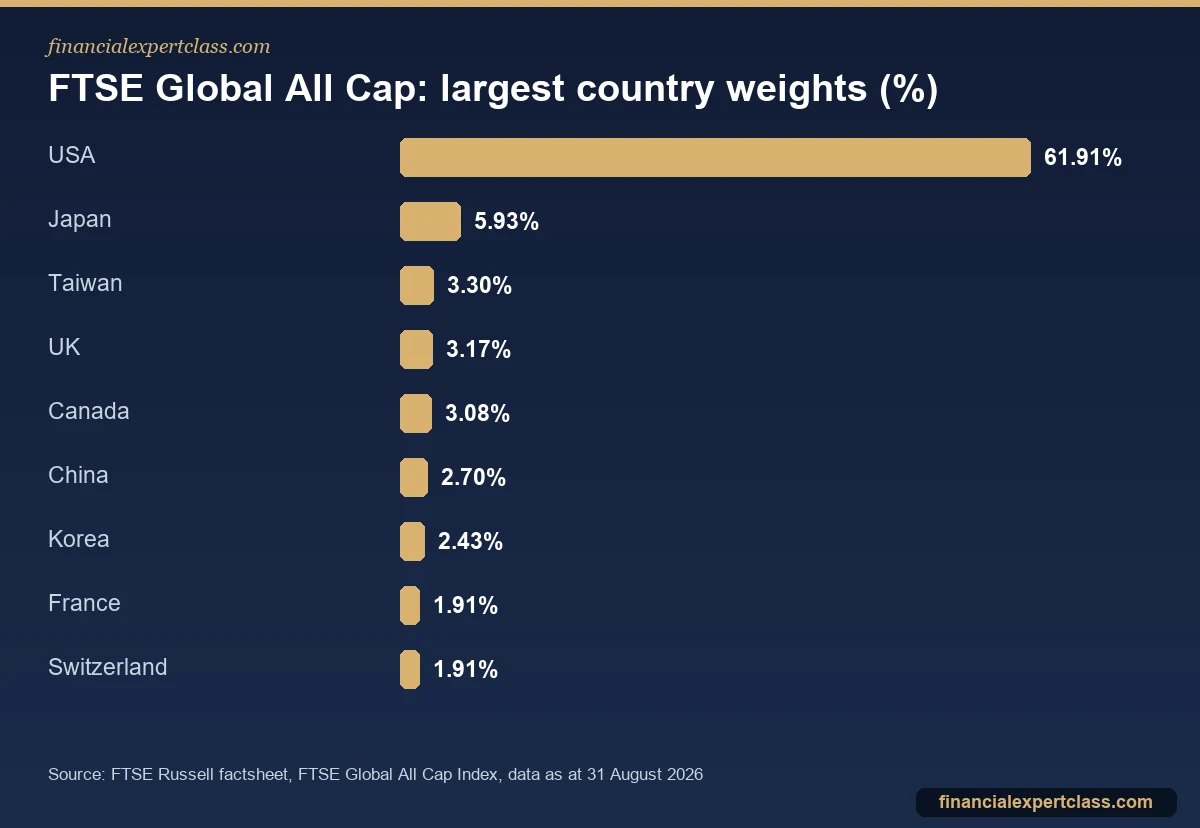
The UK, at 3.17%, is a small part of the index. That matters if you are a UK investor thinking about home bias, and we come back to it below. The index also includes emerging markets such as China (2.70%), Taiwan (3.30%), Korea (2.43%) and India (1.66%). So a single fund gives you both developed and emerging exposure.
By sector, technology is the heavyweight at 32.28% under the Industry Classification Benchmark (ICB). Next come financials at 15.29%, industrials at 13.07% and consumer discretionary at 11.13%. Health care is 8.22%. The index’s dividend yield was 1.59%. That tells you it is a growth-tilted, total-return portfolio rather than an income one.
FTSE Global All Cap vs FTSE All-World
This is the question most people searching for the index want answered. The FTSE All-World Index covers the same developed and emerging markets, but only large and mid caps. It held 4,264 stocks on the same date. Global All Cap adds the small caps on top, taking it to 10,113.

The two indices look almost identical at the level that matters most. The US weight differs by two-tenths of a percentage point, and the UK weight is practically the same. In addition, the top ten companies are slightly less dominant in All Cap. That is because the extra small companies dilute everyone else a little. Over time the two have tended to move closely together. This is what you would expect when small caps are a modest share of the total value.
So which is “better”? Neither wins on principle. All Cap is the more complete picture of the investable market. All-World, however, is simpler, and more ETFs track it, including Vanguard’s VWRP and VWRL. If you already own an All-World fund, switching to All Cap for the small-cap slice is rarely worth a sale. A sale could trigger costs or, outside an ISA or SIPP, capital gains tax. Our FTSE All-World explainer goes through the large-and-mid version in more depth.
Funds that track the index
Vanguard FTSE Global All Cap Index Fund
This is the fund most UK investors mean when they say “Global All Cap”. It is a UK-domiciled open-ended fund (OEIC) that Vanguard launched on 8 November 2016. Its total assets were £10,503 million at 31 August 2026. Vanguard’s factsheet for the GBP accumulation share class (ISIN GB00BD3RZ582) shows an ongoing charges figure (OCF) of 0.23%. It uses sampling rather than holding every stock: 7,495 holdings against 10,112 in the benchmark. As an OEIC, it deals at a single daily price rather than trading on an exchange during the day.
Vanguard FTSE Global All-Cap UCITS ETF
Vanguard launched an exchange-traded version on 18 August 2026. The Irish-domiciled, physically replicated ETF carries an OCF of 0.07% and has UK reporting fund status. It trades on the London Stock Exchange as VALL (in pounds) and VALU (in dollars). It also trades on Xetra as VGLA and on several other European exchanges. The accumulating USD share class (ISIN IE000VAHT5T0) held 6,429 stocks at the end of August 2026. Because it is so new, it has no one-year track record yet. Its assets are also small compared with the long-established fund.
Close alternatives
If you want “all cap” exposure through a longer-established ETF, the main route is an index from a different provider. For example, the SPDR MSCI ACWI IMI UCITS ETF (SPYI) tracks MSCI’s all-country investable market index. That index also includes small caps. However, MSCI and FTSE classify some countries differently, and Korea is the best-known example. So the two are close cousins rather than twins, and our MSCI vs FTSE comparison explains why.
Is a Global All Cap fund a good core holding?
Some long-term investors want one fund to cover the world’s stock markets. For them, an all-cap global tracker does the job with very little effort. You own thousands of companies, and the balance between countries adjusts automatically as markets move. The costs are also low. That simplicity is why the Vanguard fund is a common default inside stocks and shares ISAs and SIPPs.
The trade-offs are worth knowing before you buy:
- US concentration. Almost 62% of your money follows one market. Roughly a fifth sits in ten companies, most of them US technology firms.
- Currency risk. The fund’s price is in pounds, but the underlying shares are mostly in dollars, yen and other currencies. So a stronger pound reduces your returns and a weaker one boosts them.
- Small caps add little by weight. Perhaps your reason for choosing All Cap is a meaningful small-cap tilt. If so, the index will not give you one, but a dedicated fund such as a world small-cap ETF would.
- Fund versus ETF costs. The OEIC’s 0.23% is higher than the new ETF’s 0.07%. However, platforms often charge differently for funds and ETFs, so compare the total cost on your own platform.
Why UK investors like it, and the home-bias question
A UK investor holding only this index has about 3% in UK shares. Some people are comfortable with that, because it is the UK’s actual share of world markets. Others prefer to add a separate UK fund, since their future spending is in pounds. There is no correct answer, but decide deliberately rather than by accident. If you do want a separate UK holding, the natural pairing is an “ex-UK” global fund plus a UK index fund. That way you are not double-counting UK companies.
Wherever you hold it, use your tax wrappers first. A stocks and shares ISA or SIPP shelters the growth and dividends from UK tax. Our ISA, LISA and SIPP decision tree shows which wrapper to fill in which order.
Frequently asked questions
What is in the FTSE Global All Cap Index?
It holds large, mid and small company shares from developed and emerging markets: 10,113 stocks across 48 countries at 31 August 2026. The US made up 61.91%, Japan 5.93% and Taiwan 3.30%. Technology was the largest sector at 32.28%, and the top ten holdings were 21.63% of the index.
What is the difference between FTSE All-World and FTSE Global All Cap?
FTSE All-World holds only large and mid caps (4,264 stocks), while Global All Cap adds small caps (10,113 stocks in total). Country and sector weights are very similar. So All Cap is simply the more complete version of the same market.
How much does the Vanguard FTSE Global All Cap Index Fund cost?
Vanguard’s factsheet for the GBP accumulation share class showed an ongoing charges figure of 0.23% at 31 August 2026. The newer Vanguard UCITS ETF, launched on 18 August 2026, has an OCF of 0.07%. Platform or account fees come on top of both.
Is the Vanguard FTSE Global All Cap Index fund a good investment?
It is a low-cost, very diversified way to own global shares. That makes it a reasonable core holding for long-term investors. However, it still carries full stock-market risk, heavy US and technology exposure and currency risk. So whether it suits you depends on your time horizon and the rest of your portfolio.
Cited sources: FTSE Russell: FTSE Global All Cap Index factsheet, FTSE Russell: FTSE All-World Index factsheet, Vanguard FTSE Global All Cap Index Fund factsheet, and Vanguard FTSE Global All-Cap UCITS ETF factsheet. Verify current fund figures before investing. Educational content, not financial advice.
Not personalised financial advice. Verify your situation with a qualified adviser. Operated by Aurum Digital Marketing LTD (UK), Companies House 15203665.
European UCITS/ETF investor with 11+ years building a global dividend and index portfolio, and founder of Financial Expert Class. I write every guide here from first-hand experience investing across EU brokers and tax regimes — not theory. More about me →