
The FTSE Japan Index tracks 475 large and mid-sized Japanese companies. According to FTSE Russell’s factsheet as of 31 August 2026, it weights them by free-float market value. It is the benchmark for low-cost funds such as the Vanguard FTSE Japan UCITS ETF (0.10%) and the HSBC Japan Index Fund (0.12%). In breadth, it sits between the narrower MSCI Japan and the broader TOPIX.
New to ETFs? Start with the free checklist.
The European ETF Starter Kit: what to check before you buy your first UCITS ETF — domicile, costs, tax and broker set-up.
What the FTSE Japan Index is
The index is part of FTSE Russell’s Global Equity Index Series (GEIS). That is the same family behind the FTSE All-World. It covers the large and mid-cap part of the Japanese stock market. However, it leaves out small caps, so the index stays investable and liquid enough for index funds to replicate.
Key features, from FTSE Russell’s factsheet:
- Weighting: market capitalisation, adjusted for free float (only shares actually available to investors count) and screened for liquidity.
- Classification: FTSE Russell groups companies using the Industry Classification Benchmark (ICB).
- Reviews: semi-annually, in March and September.
- Base date: 31 December 1986, base value 100.
- Currencies: calculated in USD, GBP, JPY, EUR and local currency, with price, total return and net-of-tax versions.
For a UK investor, the GBP version is the one to compare fund performance against. That is because a Japan tracker bought in pounds carries yen exposure. If the yen weakens against sterling, your return falls, even if Japanese shares rise in yen terms.
Top 10 FTSE Japan constituents
As of 31 August 2026, the ten largest companies made up 25.40% of the index. The largest single stock, Mitsubishi UFJ Financial, was 3.90%. So the index is far less top-heavy than US benchmarks.
| Company | ICB sector | Weight |
|---|---|---|
| Mitsubishi UFJ Financial | Banks | 3.90% |
| Toyota Motor | Automobiles and Parts | 3.29% |
| Sumitomo Mitsui Financial Group | Banks | 2.46% |
| Tokyo Electron | Technology Hardware and Equipment | 2.42% |
| Recruit Holdings | Industrial Support Services | 2.39% |
| Advantest | Technology Hardware and Equipment | 2.38% |
| Hitachi | General Industrials | 2.34% |
| Sony | Leisure Goods | 2.31% |
| Mizuho Financial Group | Banks | 1.98% |
| SoftBank Group | Telecommunications Service Providers | 1.91% |
Source: FTSE Russell, FTSE Japan Index factsheet, data as at 31 August 2026. Constituents and weights change at each review and with market moves.
Sector weights
Japan’s market looks very different from the US. Industrials are the biggest slice, followed by financials and consumer discretionary. In Japan, carmakers and consumer electronics dominate consumer discretionary. Technology is under 15%, and consists mostly of semiconductor equipment makers such as Tokyo Electron and Advantest.
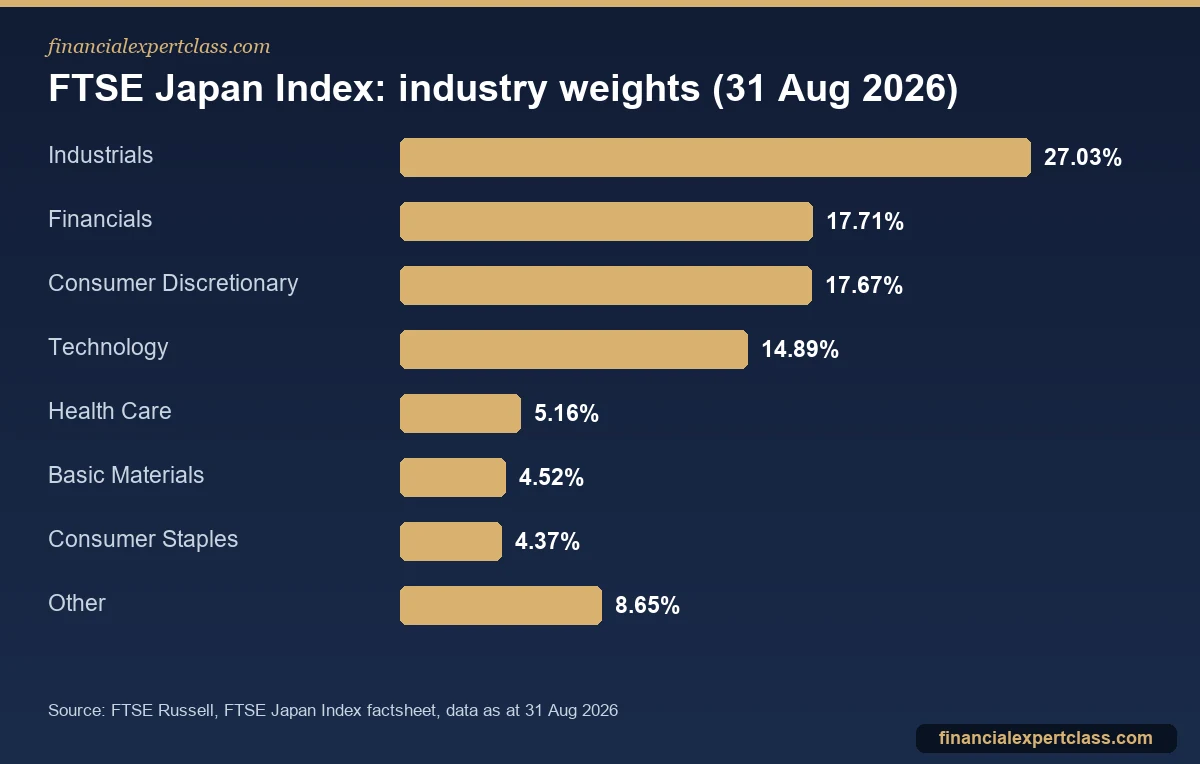
By number of companies, industrials also lead with 115 constituents, followed by 98 in consumer discretionary and 55 in technology. By contrast, energy has only five constituents (0.86%) and utilities twelve (1.30%). Other in the chart combines telecommunications (3.99%), real estate (2.50%), utilities and energy.
This mix is one reason investors hold Japan as a diversifier. It adds exposure to banks, industrial groups and exporters that are underweight in a US-heavy global fund. In HSBC’s FTSE All-World Index Fund, for example, Japan was 5.79% of the portfolio at the end of August 2026. So a dedicated Japan fund is how investors deliberately raise that weight.
FTSE Japan vs MSCI Japan vs TOPIX
Three indices dominate Japan-tracking funds. They overlap heavily at the top, where the same megabanks, Toyota, Sony, Hitachi and Tokyo Electron lead all three. However, they differ in breadth.

- MSCI Japan is the narrowest. MSCI’s factsheet lists 168 constituents as of 31 August 2026, with Mitsubishi UFJ at 4.65%. These cover about 85% of Japan’s free-float market value. Several UCITS ETFs sold in the UK track it.
- FTSE Japan sits in the middle with 475 stocks, adding more mid caps than MSCI.
- TOPIX is the broad domestic benchmark, run by Japan Exchange Group. It had 1,636 constituents as of 31 August 2026 and has a 10% single-stock weight cap. In addition, JPX has been revising the TOPIX rules. Its factsheet shows annual periodic reviews on the last business day of October from October 2026.
Because the biggest companies make up most of the value in all three, returns tend to be close over time. The differences show up in the mid-cap slice and in sector tilts.
Funds and ETFs that track the FTSE Japan Index
Two widely available options for UK investors track the index directly:
- Vanguard FTSE Japan UCITS ETF: OCF 0.10%, Irish-domiciled, holding all 475 stocks as of 31 August 2026. The distributing share class (ISIN IE00B95PGT31) pays quarterly. It trades as VJPN in pounds and VDJP in dollars on the London Stock Exchange. Vanguard also offers an accumulating share class.
- HSBC Japan Index Fund (C Acc): a UK OEIC with an OCF of 0.120% and a fund size of about £2.23 billion. It uses full replication of the index, per HSBC’s factsheet dated 31 August 2026. It is ISA-eligible, and HSBC values it daily at 12:00 UK time.
You may want to compare Japan ETFs more broadly, including MSCI Japan and currency-hedged versions. If so, see our guide to the best Japan ETFs. For wider Asian exposure, our overview of Asia ETFs covers regional funds that include Japan alongside other markets.
Currency: the part of the return the index does not show
FTSE Russell’s factsheet reports the index in yen. Similarly, headline returns in Japanese media are usually in yen too. However, a UK investor in an unhedged tracker earns the yen return plus or minus the yen’s move against the pound. Over short periods the currency move can be as large as the share price move, in either direction.
Some providers offer currency-hedged share classes of Japan funds. These aim to strip out most of the yen-sterling movement at a small extra cost. Hedging makes sense if you want pure exposure to Japanese company performance. On the other hand, an unhedged fund makes sense if you are happy for the yen to act as part of your diversification. Whichever you choose, compare fund returns against the index version in the same currency. Otherwise tracking looks better or worse than it really is.
Should you hold a separate Japan fund?
Most investors already own Japan through a global fund. A MSCI World or FTSE All-World tracker includes the large Japanese companies at their market weight. So adding a separate FTSE Japan fund is a deliberate overweight. That can make sense if you want more exposure to Japanese valuations or dividends. It can also reduce dependence on US technology. But it adds yen risk and another holding to rebalance.
A practical approach is to decide on a target weight first. For example, you might aim a few percentage points above Japan’s weight in your global fund. Then use the cheapest tracker available on your platform. If you are unsure how many funds a simple portfolio needs, read how many ETFs you should own.
Frequently asked questions
How many companies are in the FTSE Japan Index?
475 as of 31 August 2026, according to FTSE Russell. The number changes at the semi-annual reviews in March and September.
What is the difference between FTSE Japan and MSCI Japan?
Both cover large and mid-cap Japanese stocks. However, FTSE Japan is broader, with 475 constituents against 168 for MSCI Japan as of 31 August 2026. The top holdings are largely the same, so returns tend to be similar.
Which ETF tracks the FTSE Japan Index?
The Vanguard FTSE Japan UCITS ETF tracks it, with an OCF of 0.10%. It trades as VJPN in pounds and VDJP in dollars on the London Stock Exchange. In addition, the HSBC Japan Index Fund is a UK OEIC that tracks the same index with an OCF of 0.12%.
Does the FTSE Japan Index pay dividends?
The index itself has a dividend yield of 1.83% as of 31 August 2026. Distributing funds that track it, such as VJPN, pass that income on quarterly after costs. Accumulating versions, by contrast, reinvest it.
Cited sources: FTSE Russell: FTSE Japan Index factsheet, MSCI Japan Index factsheet, JPX: TOPIX factsheet, Vanguard FTSE Japan UCITS ETF, HSBC Japan Index Fund factsheet, and HSBC FTSE All-World Index Fund factsheet. Verify current fund figures before investing. Educational content, not financial advice.
Not personalised financial advice. Verify your situation with a qualified adviser. Operated by Aurum Digital Marketing LTD (UK), Companies House 15203665.
European UCITS/ETF investor with 11+ years building a global dividend and index portfolio, and founder of Financial Expert Class. I write every guide here from first-hand experience investing across EU brokers and tax regimes — not theory. More about me →