
ETF Holdings Analysis – Underlying Asset Examination
Exchange-traded funds (ETFs) promise instant diversification. However, what really lurks beneath the ticker? Beneath every sleek three-letter code lies a complex mesh. Country weights, sector tilts and single-stock concentrations can either turbo-charge or torpedo long-term returns. This deep-dive unpacks the anatomy of three workhorse equity exposures favoured by European investors. They include iShares Core MSCI World (IWDA), Vanguard FTSE All-World (VWCE) and the Eurozone bellwether Xtrackers Euro Stoxx 50 (XESC). Along the way we test common assumptions. Additionally, we flag hidden risks and outline practical portfolio actions.
Why Holdings Transparency Matters
Daily holdings disclosure has become an industry norm for European UCITS ETFs. Consequently, investors can scrutinise exposures in real time. This visibility empowers three actions:
- Risk auditing – spot unintended country or single-stock bets before they balloon.
- Efficient rebalancing – fine-tune strategic allocations with data rather than gut feel.
- Cost control – compare overlapping ETFs and avoid paying twice for the same exposure.
The Three Contenders
| ETF (Ticker) | Index | Holdings | TER | Key Focus |
|---|---|---|---|---|
| IWDA | MSCI World | ≈1,350 | 0.20% | Developed-market large & mid caps |
| VWCE | FTSE All-World | ≈3,600 | 0.14% (Sept 2026) | Developed + emerging large & mid caps |
| XESC | Euro Stoxx 50 | 50 | 0.09% | Eurozone blue chips |
Source: fund factsheets, July 2025.
Single-Stock Concentration: Mega-Cap Dominance
Tech giants rule global benchmarks. However, the degree of dominance differs. IWDA allocates 25.8% to its top-10 names. By contrast, VWCE sits at 21.4%. Notably, the Euro Stoxx 50 packs 40% into ten firms. This reflects a narrower stock universe.
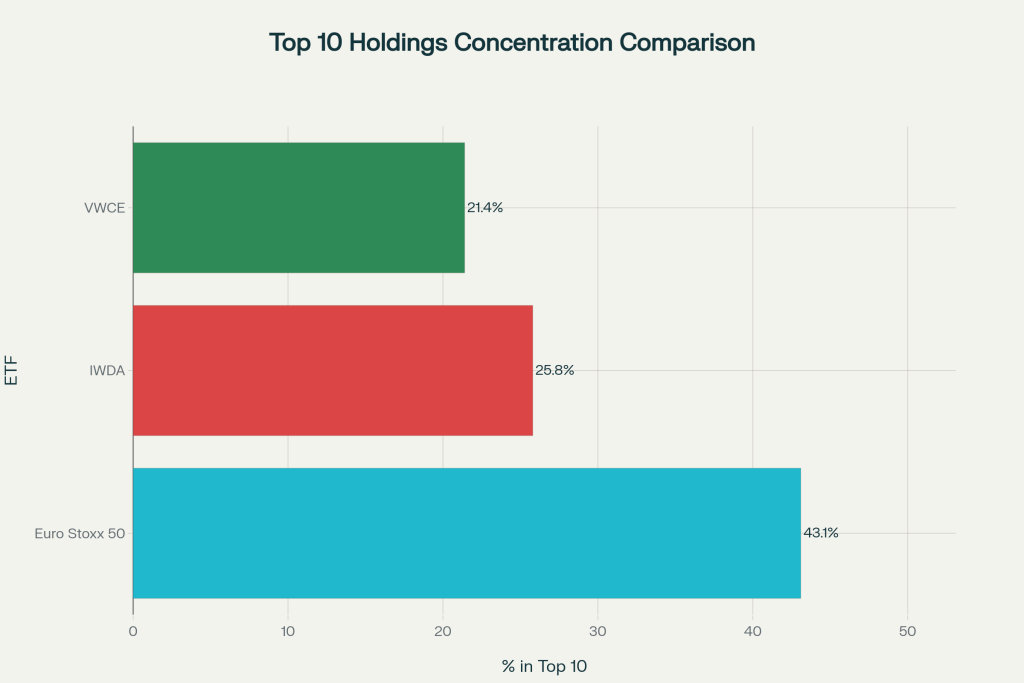
Top 10 Holdings Concentration Comparison across three major ETFs
Take-away: A broad ETF does not necessarily dilute mega-cap risk. Therefore, always inspect the top-10 weight. Position-size limits (e.g., 5% per issuer in UCITS) help. However, they do not eliminate concentration.
Sector Skews: Growth Tilt vs Eurozone Cyclicality
Sector exposure drives return dispersion when macro winds shift. The chart below contrasts the three funds across ten GICS sectors.

Sector allocation comparison showing GICS sector distribution across IWDA, VWCE, and Euro Stoxx 50 ETFs
Key Observations
-
Tech premium still dominates IWDA & VWCE allocations
-
Eurozone basket leans heavily on industrials and cyclicals
-
Financial exposure hovers around 17-18% across global funds but drops in Euro Stoxx 50
Geographic Breadth Comparison
| Region | IWDA % | VWCE % |
|---|---|---|
| North America | 71.6 | 64.1 |
| Europe ex-Eurozone | 8.4 | 7.2 |
| Asia-Pacific Dev. | 7.6 | 7.3 |
| Emerging Markets | — | 15.4 |
VWCE’s emerging market slice injects CNY, TWD and INR exposure. Moreover, it dilutes US dollar concentration. This adds both growth optionality and volatility. For full-market capture seekers, that is a feature, not a bug.
Browse the full series in our ETF comparison hub.
Valuation & Factor Analysis
| Metric | IWDA | VWCE | Euro Stoxx 50 |
|---|---|---|---|
| Price/Earnings | 24.15 | 18.5 | 14.2 |
| Dividend Yield | 1.72% | 2.10% | 2.7% |
| 3-yr EPS Growth | 9.1% | 9.0% | 5.8% |
Lower multiples make Eurozone blue chips appear temptingly cheap. However, slower growth rates and concentrated sector bets dilute the margin of safety.
Hidden Risks to Monitor
- Liquidity traps – the Euro Stoxx 50 has thin secondary-market volumes in several constituents; bid-ask spreads can widen fast in stress windows.
- Style drift – despite passive branding, index revisions (e.g., MSCI reviews [53]) can introduce abrupt country upgrades or deletions.
- Regulatory shifts – Central Bank of Ireland’s 2025 transparency rule change [48] may raise operating costs for Irish-domiciled ETFs, squeezing TER over time.
- Home bias complacency – MSCI observed a rare 10-point outperformance of non-US stocks in early 2025 [59]; staying global limits regret risk if leadership flips.
Portfolio Construction Ideas
Armed with holdings intel, European investors can craft balanced exposure:
- Core–satellite mix: Hold IWDA or VWCE as a core, bolt on Euro Stoxx 50 for tactical EUR-beta or dividend tilt.
- Factor overlay: Pair mega-cap ETFs with size, value or equal-weight indices (e.g., Euro Stoxx 50 Equal Weight [34]) to dilute concentration.
- Currency hedge: Layer EUR-hedged share classes if USD swings whipsaw the plan.
- Cost discipline: The 2-4 bps TER gap matters less than tax drag; choose accumulating share classes inside tax-deferred wrappers when possible.
Real-World Case Study
Sofia, 42, a Berlin-based software engineer, runs a €200k portfolio. She splits it 70% equities, 30% bonds. She held only IWDA. However, she worried about US tech exuberance. After a holdings review:
- Sold 15% IWDA.
- Bought 10% VWCE to gain EM exposure.
- Added 5% Euro Stoxx 50 Equal Weight for income and cyclical tilt.
Result: US weight fell from 50% to 43%. Moreover, sector GICS variance tightened. Forward yield rose to 2.2% without hiking portfolio TER.
Learning ETFs the slow way?
The free 12-page Starter Kit gets you to a first, sensible portfolio faster: the 7-filter fund shortcut, the 3-question broker matrix, and the 7 costliest beginner mistakes.
How Do ETF Provider Choices Impact the Underlying Asset Analysis in ETF Holdings?
ETF provider choices significantly influence the analysis of underlying assets. Therefore, they shape risk assessment and performance expectations. By understanding the methodologies of each provider, investors can enhance their decision-making process. This is crucial when comparing top etf providers effectively to identify the best options that align with their investment strategies.
Checklist Before You Buy
- Download the latest holdings CSV; scan top-10 and top-25 weights.
- Compare sector spread against personal macro view.
- Check domicile for withholding-tax drag.
- Review liquidity (average daily volume, spreads).
- Confirm distribution policy aligns with tax status.
Conclusion
An ETF’s true character hides in its holdings grid, not its marketing label. By analysing single-stock exposure, sector composition, regional reach and valuation factors, European investors can avoid blind spots. Consequently, they build resilient portfolios. Whether you embrace the broad sweep of VWCE, the developed-world purity of IWDA or the Eurozone blue-chip focus of XESC, keep the microscope handy. In short, transparency is only valuable when you use it.
Sources and further reading
- justETF — European UCITS ETF screener
- Morningstar UK ETF rankings
- ESMA — European Securities and Markets Authority
- Bogleheads wiki — EU investing
- ETF.com industry data
European UCITS/ETF investor with 11+ years building a global dividend and index portfolio, and founder of Financial Expert Class. I write every guide here from first-hand experience investing across EU brokers and tax regimes — not theory. More about me →