
Clean Energy ETFs – A European Investor’s Guide to Renewable Themes
For a curated ESG-rated shortlist, the sustainability ETF tool maintains the filter.
Educational content only – not FCA-regulated advice. For the wider context, see our best green and ESG ETFs hub and our European ETF providers comparison.
European investors eyeing a greener portfolio have more choice than ever. Exchange-traded funds (ETFs) focused on renewable energy wrap dozens of global clean-tech shares into a single trade. As a result, they offer instant diversification across solar, wind, hydro, grid technology, and beyond. Clean energy ETFs can ride policy tailwinds like the EU’s REPowerEU plan. Meanwhile, they spread the risks of backing any one company. This article unpacks the key products, performance drivers, and practical considerations for selecting the best-fit fund. Additionally, more investors now seek sustainable options, so the popularity of energy-focused exchange-traded funds keeps rising. Notably, these funds attract both seasoned and novice investors alike. Moreover, they provide exposure to a rapidly evolving sector. They also align with growing environmental, social, and governance (ESG) principles. Therefore, understanding the nuances of these offerings can empower investors. In short, you can make informed decisions that match your sustainability goals.
New on the site: my VanEck Rare Earth ETF (REMX) review.
Additionally, utilities ETFs for European investors provide a stable investment avenue. Specifically, they focus on companies that operate in essential service areas like electricity and water. In practice, these funds often complement clean energy ETFs. They integrate traditional and renewable utility providers. Consequently, they ensure a more balanced approach to energy investments. As demand for sustainable and reliable energy sources grows, diversifying into both green and utility sectors helps. Therefore, this approach can lead to more resilient portfolios.
Related: my Nuclear ETFs Europe guide covers this in depth.
Related: my copper miners electrification review covers this in depth.
New on the site: the broad Europe 600 fund review.
For a European investor the choice is narrower than the ticker lists suggest: the US-listed ICLN cannot be bought, so the practical route into the theme is a UCITS fund – INRG for liquidity, or RENW, NEWN and TANN for cheaper or purer variants. Expect roughly 1.3–1.6× the volatility of a broad MSCI World tracker for it, and size the position as a satellite rather than a core holding.
Renewable Energy ETFs vs Green and Sustainable Energy ETFs: What’s the Difference?
Search for a “renewable energy ETF”, a “green ETF” or a “sustainable energy ETF” and the results overlap. However, the labels are not interchangeable. Each one describes a different slice of the market.
- Renewable energy ETFs are the narrowest. They target firms that generate power from wind, solar or hydro, plus the makers of that equipment.
- Clean energy ETFs go wider. Alongside generators, they add grid, storage and enabling technology.
- Alternative or “new energy” ETFs can go wider still, for example into hydrogen, fuel cells and batteries.
- Green and sustainable ETFs are often a label, not a sector. A “green” fund may be a broad ESG-screened world tracker with no energy focus at all. So check the index name, not the fund name.
The category leader shows how blurred the lines are. As of 29 September 2026, the iShares Global Clean Energy Transition UCITS ETF (INRG) held 106 stocks. Utilities made up 40.7% of the fund, industrials 35.0% and information technology 21.9%. Its TER is 0.65%. In other words, even the best-known “clean energy” ETF is part power producer, part equipment maker and part tech fund.
So which is the best renewable energy ETF? That depends on how pure you want the exposure to be. For generators and equipment only, compare the index rules in the table below. For a simply lower-carbon portfolio, a broad ESG tracker may suit you better than a thematic fund.
Why the Theme Matters
Europe’s policy backdrop is turbo-charging renewables. Importantly, Parliament has locked in a legally binding 42.5% share of renewables in final energy consumption by 2030. The plan also targets an aspirational 45%. Moreover, REPowerEU hikes the target to 45% renewables in the energy mix. In addition, it calls for 600 GW of solar PV by 2030. National energy plans already map out 450 GW of wind. They also target up to 672 GW of solar capacity this decade. Consequently, these ambitions translate into multi-billion-euro capex pipelines. The pipelines support turbine makers, grid operators, and component suppliers. Therefore, this is prime real estate for thematic ETFs. The legal backbone here is the EU Taxonomy Regulation 2020/852. Crucially, it defines what counts as a “sustainable” economic activity for green-labelled funds.
Core Clean-Energy ETFs Available in Europe
| ETF (Ticker) | Index Tracked | Assets €m | TER | Structure | Domicile | Income Policy |
|---|---|---|---|---|---|---|
| iShares Global Clean Energy Transition (INRG) | S&P Global Clean Energy Transition | USD 3,387m (fund, 30 Sep 2026) | 0.65 % | Physical | Ireland | Distributing |
| L&G Clean Energy (RENW) | Solactive Clean Energy | 229 | 0.49 % | Physical | Ireland | Accumulating |
| Amundi MSCI New Energy (NEWN) | MSCI ACWI IMI New Energy | 574 | 0.60 % | Physical | France | Distributing |
| Invesco Solar Energy (TANN) | Solar-focused | 34 | 0.69 % | Physical | Ireland | Accumulating |
| Deka Future Energy ESG (ETF L60) | Future energy ESG | 22 | 0.55 % | Physical | Germany | Distributing |
We cross-checked source data against the iShares UK product pages and justETF screener as of the review date.
What to Watch
- Index methodology: INRG caps constituents to avoid single-stock dominance. Therefore, it reduces volatility. By contrast, RENW applies a quality screen. It tilts toward grid and storage names.
- Cost vs. liquidity: INRG is cheapest to trade thanks to about USD 3.4 billion in fund assets (30 September 2026). TER spreads between funds are slim. However, bid-ask spreads differ markedly.
- Dividend treatment: Income seekers may prefer distributing share classes like INRG. By contrast, growth investors might opt for accumulating RENW.
INRG vs ICLN: The UCITS vs US 40-Act Distinction
Same index, different wrapper, and only one of them is buyable in the EU. INRG is the Irish-domiciled UCITS fund your European broker will sell you; ICLN is the US 40-Act version, blocked at the order screen since PRIIPs took effect because it has no EU key information document. Irish domicile also halves the fund-level US dividend withholding tax, from 30% to 15%.
European investors often see “ICLN” referenced in US articles. Then they assume it is the same product. However, it is not. ICLN is the US-domiciled iShares Global Clean Energy ETF. It is registered under the US Investment Company Act of 1940. EU retail investors generally cannot buy ICLN on a Continental broker. The reason is simple: it lacks a PRIIPs Key Information Document. By contrast, INRG is the UCITS sibling. It is domiciled in Ireland, distributing, and fully PRIIPs-compliant. Both follow the same S&P Global Clean Energy Transition methodology. However, INRG layers in the UCITS 5/10/40 concentration limits. It also adds ESG screens required for sale to EU retail.
- Domicile: ICLN = US (40-Act). INRG = Ireland (UCITS).
- Tax treatment: ICLN distributions can carry 30% US withholding tax for non-treaty residents. By contrast, INRG benefits from Ireland’s tax treaty network. Typically, it pays 15% on US dividends inside the wrapper.
- Accessibility: Most EU brokers refuse ICLN since 2018 MiFID II / PRIIPs. INRG trades on Xetra, Borsa Italiana, Euronext Amsterdam, and the LSE.
- Cost: ICLN has a lower headline expense ratio of around 0.41%. However, the higher dividend tax leakage often makes INRG more efficient net of taxes for euro-area holders.
For deeper context on UCITS rules and why they matter, see our complete UCITS guide for European investors.
SFDR Article 8 vs Article 9: How EU Sustainability Labelling Works
Under the Sustainable Finance Disclosure Regulation (SFDR) 2019/2088, every EU-marketed fund falls into one of three buckets:
- Article 6: No specific sustainability claim. Most plain-vanilla ETFs.
- Article 8 (“light green”): Promotes environmental or social characteristics. However, it does not have sustainability as its core objective. Many broad ESG ETFs sit here.
- Article 9 (“dark green”): Has sustainable investment as its objective. Stricter rules apply. Moreover, it requires mandatory disclosure of EU Taxonomy alignment percentages.
Not every clean-energy ETF is Article 9. In fact, iShares lists INRG as Article 8 (checked 1 October 2026). Its SFDR classification changed on 1 December 2022. Classifications differ between funds and can change, so check each fund’s own SFDR disclosure. For broader ESG context, our smart ESG ETF guide and thematic ETF deep dive compare alternative approaches.
Performance Snapshot
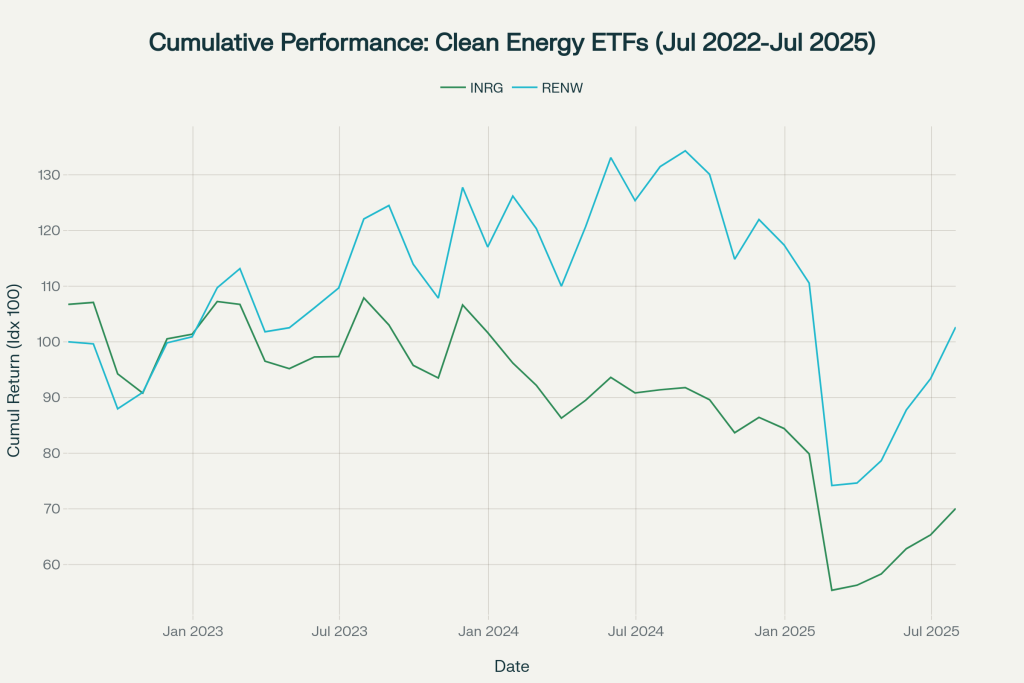
Over the past three years, RENW has outpaced INRG. It recovered faster from the 2023 sell-off. The reason: it holds more grid-modernisation names. These names benefit from AI-driven power demand surges. By contrast, INRG remains broader but heavier in rate-sensitive utilities. These utilities lagged when yields spiked. Heading into 2026, the post-rate-hike cycle has shifted the maths. As ECB and Federal Reserve cuts feed through into long bond yields, the discount rate on long-duration renewable cash flows is finally compressing again. Past performance is not a reliable indicator of future returns.
Policy Tailwinds Behind the Theme
The clean-energy ETF thesis does not rest on hope. Instead, it rests on legislated, multi-year capex commitments. European utilities and industrials are already deploying these commitments. REPowerEU anchors a 600 GW solar PV target by 2030. It is the European Commission’s response to the 2022 gas-supply shock. Moreover, it calls for an effective doubling of the EU’s heat-pump rollout. The accompanying Net-Zero Industry Act sets a benchmark. Specifically, at least 40% of strategic clean-tech manufacturing capacity must be located inside the EU by 2030. Consequently, this directly benefits index constituents. Examples include Nordex (wind turbines), Vestas (offshore wind), and SMA Solar (inverters).
On the demand side, the Renewable Energy Directive III (RED III) raises the binding 2030 renewables share to 42.5% of gross final energy consumption. The directive also adds an indicative top-up to 45%. National Energy and Climate Plans go to ESMA-overseen frameworks. These plans already aggregate roughly 450 GW of installed wind capacity. They also target up to 672 GW of solar PV by 2030. Additionally, the Innovation Fund is releasing tens of billions of euros. EU Emissions Trading System revenues finance the fund. The money flows into hydrogen electrolysers, battery gigafactories, and carbon capture. Notably, all these categories appear in the underlying indices behind INRG and RENW.
Crucially for ETF investors, this is not a one-country story. The US Inflation Reduction Act (IRA) continues to bankroll roughly USD 369 billion of clean-energy tax credits over a decade. Moreover, US-listed names like First Solar, Enphase, and NextEra Energy remain heavyweights inside the S&P Global Clean Energy Transition index. INRG tracks that index. China’s grid build-out adds a third leg. Its dominance in polysilicon and battery supply chains also matters. Investors access this exposure through Hong Kong-listed constituents such as Xinyi Solar and Longi Green Energy. Therefore, a global thematic ETF captures three overlapping policy regimes in one ticker.
Risks Investors Need to Price In
Thematic concentration cuts both ways. Clean-energy ETFs typically run a beta of 1.3 to 1.6 versus the MSCI World. In practice, a 10% broad-market drawdown can translate into a 15-16% drop in INRG or RENW. Three risks dominate the file.
Interest-rate sensitivity. Renewable developers finance long-dated projects with debt. Therefore, discounted cash-flow valuations are sensitive to the long end of the yield curve. The 2022-2023 rate-hike cycle compressed clean-energy multiples by roughly 40% from peak. However, 2025-2026 ECB cuts have eased the pressure. Any reacceleration in inflation could reverse the recovery quickly.
Policy reversal risk. A change of US administration, EU budget tightening, or national-level cuts to feed-in tariffs can hit the theme. Notably, it can hit harder than diversified equity. The 2024 partial rollback of certain IRA provisions illustrated how quickly sentiment can swing. Moreover, SFDR Article 9 funds also face downgrade risk. Between 2022 and 2024, regulators reclassified more than 300 funds from Article 9 to Article 8. The reason: methodology guidance tightened. Consequently, any future reclassification of INRG, RENW, NEWN, or TANN would force some institutional holders to exit.
Supply-chain and tech-overlap risk. Solar inverters, wind-turbine power electronics, and battery management systems depend on semiconductor supply. A bottleneck at TSMC or Infineon ripples directly into clean-energy revenues. This is a reminder of why some investors pair a thematic ETF with broader semiconductor ETFs covering ASML, Infineon, and other European chip plays. It works as a hedge against component scarcity. Smart-grid and digital-substation rollouts also raise the attack surface for cyber risk. Therefore, operators have stepped up procurement of intrusion-detection and operational-technology security. Our guide to cybersecurity ETFs covers this area.
Finally, you should not ignore currency risk. A euro-based investor in INRG carries USD, CNY, and DKK exposure through the underlying constituents. A 5% strengthening of the euro against the dollar can knock 2-3% off NAV in a year. This happens independent of the underlying business performance.
Selection Checklist for European Buyers
Before clicking “buy” on any of the funds in the table, walk through the following six-step checklist. It mirrors the framework I use in my own portfolio. Moreover, the Bogleheads community teaches the same framework for any thematic allocation.
- UCITS confirmation. Verify the ISIN starts with “IE”, “LU”, “FR”, or “DE”. Also confirm that a Key Information Document (KID) in your language exists. If your broker cannot produce a KID, the fund is not legally marketable to EU retail investors.
- SFDR classification. Pull the prospectus. Then confirm whether the fund is Article 8 or Article 9. Cross-check the EU Taxonomy alignment percentage in the latest annual sustainability report.
- TER and total cost of ownership. Headline TER is only half the story. Layer in bid-ask spread. Spreads typically run 0.10-0.25% on INRG and 0.20-0.35% on smaller funds. Also add broker commission and tracking difference versus the index. A 0.10% TER saving can vanish when a 0.20% spread hits a small position.
- Replication method. All five funds in the table use physical replication. Consequently, this avoids counterparty risk inherent in synthetic swaps. Confirm whether the fund uses securities lending. Also check what share of revenue accrues to fund holders.
- Domicile and tax efficiency. Irish-domiciled funds typically capture 15% US withholding tax via the Ireland-US treaty. By contrast, non-treaty jurisdictions face 30%. German-domiciled Deka L60 enjoys the EU passport. However, its distribution profile differs from Irish accumulators.
- Liquidity and listing venue. Check primary listing (Xetra, Borsa Italiana, LSE, Euronext). Also check average daily volume. A €10,000 trade in INRG on Xetra mid-session should fill at midpoint. By contrast, the same order in TANN may require a limit order to avoid spread slippage.
Portfolio Examples
How much clean-energy exposure is “enough” without overdoing the thematic concentration? Three sample sleeves illustrate common European investor profiles. None of these are recommendations. They are illustrative weightings for a hypothetical EUR 100,000 portfolio.
Sleeve A – Conservative core-satellite (3% clean energy). The mix: 70% world equity (VWCE or SPDR ACWI IMI), 20% EUR aggregate bonds, 7% gold and cash, 3% INRG. This treats clean energy as a tilt rather than a bet. At a 1.5 beta, the 3% sleeve adds roughly 0.045 of marginal market exposure. Importantly, that is small enough that a 50% thematic drawdown only costs the overall portfolio 1.5%. It pairs naturally with the framework in our balanced ETF portfolio guide.
Learning ETFs the slow way?
The free 12-page Starter Kit gets you to a first, sensible portfolio faster: the 7-filter fund shortcut, the 3-question broker matrix, and the 7 costliest beginner mistakes.
Sleeve B – Conviction ESG investor (8% clean energy). The mix: 55% world ESG-screened equity, 15% EUR green bonds, 10% broad ESG (Article 8), 8% INRG, 7% RENW, 5% cash. This profile suits an investor whose values priority is high. However, this investor still wants the diversification of broad indices. Splitting between INRG and RENW reduces single-index methodology risk. Notably, INRG follows S&P while RENW follows Solactive. As a result, they hold meaningfully different baskets.
Sleeve C – Growth-tilted thematic stack (15% clean energy + adjacent themes). The mix: 50% world equity, 10% emerging markets, 8% INRG, 5% TANN (solar), 4% NEWN, 8% semiconductors, 5% cybersecurity, 10% bonds and cash. This is the most aggressive profile. It blends four thematic ETFs that share the energy-transition supply chain. The total thematic load (28%) requires conviction. Expect drawdowns of 25-40% in cyclical bottoms.
Across all three sleeves, the principle is the same. Size the position so that a worst-case 50% drawdown on the theme does not derail your overall financial plan.
Trading Tips and Broker Considerations
Execution matters more for thematic ETFs than for broad-market trackers. The reason: spreads are wider and intraday volume is thinner. Here are a few practical rules.
Use limit orders, not market orders. Even on INRG, a market order can fill 0.30-0.50% away from NAV. This happens during the first or last 10 minutes of the trading day. Therefore, place a limit at or just inside the midpoint of the bid-ask spread.
Trade during overlap hours. The deepest liquidity for European clean-energy ETFs falls between 15:30 and 17:30 CET. During that window, US markets are open. Moreover, authorised participants can hedge underlying US constituents in real time. Spreads typically tighten by 30-50% during this window.
Match listing to base currency. If your portfolio is in EUR, prefer Xetra (EUR) or Borsa Italiana (EUR) listings. This avoids FX conversion fees on the LSE GBP line. The fund’s underlying NAV is identical. However, conversion costs from your broker can add 0.25-0.50% per round trip.
Broker fit. For frequent small purchases (monthly DCA), commission-free or low-flat-fee brokers like Trade Republic and XTB win on cost. By contrast, larger single tickets or access to multiple listing venues favor Interactive Brokers and Freedom24. They offer broader execution choice. The right broker depends on order size, frequency, and the listing you want to access. Our European ETF brokers hub compares the trade-offs.
2026-2030 Outlook
Three structural forces will shape clean-energy ETF returns over the rest of this decade. First, the discount-rate tailwind. As ECB and Fed policy rates normalise toward neutral, the present value of long-duration renewable cash flows expands. Consensus terminal-rate estimates currently sit around 2.00-2.25% for the ECB and 3.25-3.50% for the Fed. Notably, both sit meaningfully below 2023 peaks.
Second, the AI-driven power demand surge. Data centres are reshaping electricity load curves. The International Energy Agency projects global data-centre electricity consumption could double by 2030. Hyperscalers including Microsoft, Google, and Amazon have signed multi-gigawatt power purchase agreements with renewable developers. Consequently, this provides visible long-term revenue for index constituents. Grid operators and transmission specialists benefit most directly. They are over-represented in RENW versus INRG.
Third, supply-chain reshoring. The Net-Zero Industry Act and IRA together push for more EU- and US-located manufacturing of solar modules, batteries, and electrolysers. This raises near-term unit costs. However, it reduces geopolitical risk and supports higher long-term margins for non-Chinese producers. Investors should expect a multi-year transition. During this period, Chinese commodity producers will compress margins. Meanwhile, Western champions consolidate market share.
None of this guarantees outperformance. Thematic ETFs lagged the broad market for three of the past five years. Moreover, they could do so again. The case for a strategic allocation rests on policy durability, secular demand growth, and the diversification benefit a non-correlated theme adds to a world-equity core. It does not rest on a forecast of near-term outperformance.
Frequently Asked Questions
What is the difference between INRG and ICLN?
They track the same S&P Global Clean Energy index but sit in different regulatory wrappers. INRG is the Irish-domiciled UCITS version, and it is the one European brokers can sell you. ICLN is the US 40-Act version: since the PRIIPs rules took effect in 2018 it has no EU-compliant key information document, so EU retail investors are refused at the order screen. Irish domicile also cuts US dividend withholding tax inside the fund to 15% under the US-Ireland treaty, against 30% for a non-treaty wrapper.
Are clean energy ETFs Article 8 or Article 9 under SFDR?
Not all of them are Article 9. iShares lists INRG as Article 8 under SFDR (Regulation 2019/2088), as of 1 October 2026. Article 8 funds promote environmental or social characteristics. Article 9 funds have sustainable investment as their objective. Classifications can change, so check each fund’s own SFDR disclosure. The label is a disclosure regime, not a quality rating: it tells you what the manager has committed to disclose, not how much of the portfolio is genuinely aligned. Check the fund’s own periodic SFDR annex for the actual taxonomy-alignment percentage, which is typically 25%–60% under Regulation 2020/852.
Are clean energy ETFs riskier than broad equity ETFs?
Materially, yes. Realised volatility runs roughly 1.3–1.6× that of MSCI World, and the drawdowns are worse than that ratio implies because the theme is concentrated in a few dozen rate-sensitive, policy-dependent names. Clean energy fell far harder than global equity through the 2022–2023 rate-rise cycle, when higher discount rates hit long-duration project cash flows. Treat it as a satellite position of a few percent, not a substitute for a broad index holding. See our balanced ETF portfolio guide for sizing.
Do clean energy ETFs pay dividends?
Some do. INRG, NEWN and the Deka L60 fund are distributing share classes and pay out; RENW and TANN accumulate, reinvesting income inside the fund. Yields are low for the theme – these are growth-stage utilities and equipment makers, not income stocks – so pick the share class on tax grounds rather than yield. Which one is better after tax depends entirely on your country: see the accumulating vs distributing tax calculator.
How is a clean energy ETF taxed in the EU?
Exactly like any other UCITS equity ETF – there is no green tax break. Your country of residence decides: Germany applies the Vorabpauschale to accumulating funds with a 30% Teilfreistellung, Ireland charges exit tax with deemed disposal every eight years, Belgium levies TOB on each trade. The country-by-country position is in the EU ETF tax dataset. This is not tax advice.
Key Takeaways
Clean-energy ETFs pack policy catalysts, global diversification, and low-cost access. Notably, INRG offers deepest liquidity. By contrast, RENW provides cheaper TER plus grid tilt. Size positions so a 50% drawdown does not derail your plan. Additionally, pair with semiconductor and cybersecurity exposure to hedge supply-chain and digital-grid risks. Moreover, use limit orders during US-EU overlap hours to minimise execution drag. See our editorial process and affiliate disclosure.
Disclaimer: Educational only, not FCA-regulated advice.
The frontier slice of the transition: hydrogen — the transition’s least proven, most option-like corner — gets its own post-bubble assessment in the L&G Hydrogen Economy (HTWO) review, sized under moonshot rules.
Flagship deep dive: the category leader’s full review — the 2021 bubble autopsy, the reformed index and the post-crash case — is now live: iShares Global Clean Energy Transition (INRG).
Put a number on the domicile question: the gap between an Irish and a Luxembourg fund on US dividends is worth roughly fifteen basis points a year — our free ETF withholding tax calculator models that leakage on your own allocation.
What counts as a renewable energy ETF?
A renewable energy ETF holds companies generating power from wind, solar, hydro and other renewables — plus, depending on the index, equipment makers and grid technology. That definition matters: some “clean energy” funds include utilities still burning gas, while stricter indices screen for revenue purity. The fund-by-fund sections above show which camp each UCITS option falls into, and why the iShares Global Clean Energy ETF’s index rules changed after 2021’s concentration problems.

European UCITS/ETF investor with 11+ years building a global dividend and index portfolio, and founder of Financial Expert Class. I write every guide here from first-hand experience investing across EU brokers and tax regimes — not theory. More about me →