
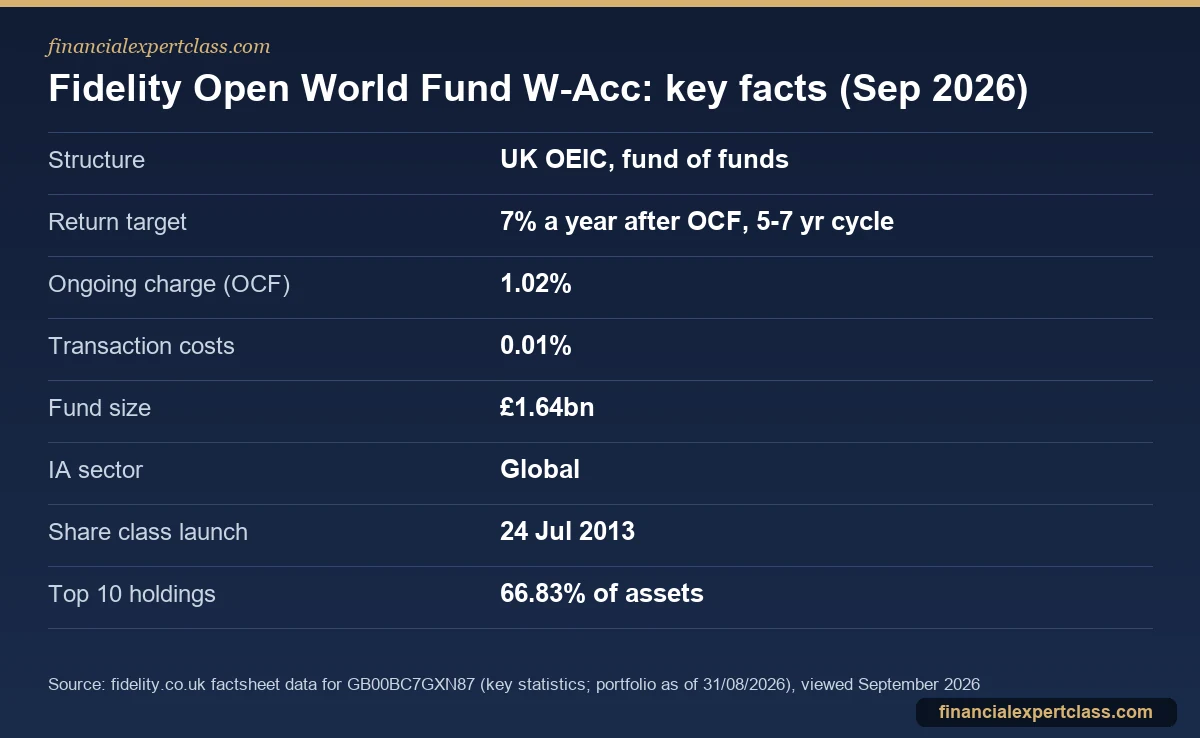
Fidelity Open World Fund W-Accumulation is a UK fund of funds. It targets an average return of 7% a year after charges over a 5-7 year market cycle. To do so, it invests at least 70% in other funds, both index trackers and active funds. Its ongoing charge is 1.02% a year. So it is a reasonable one-stop global fund, but a global index tracker costs a fraction of that.
Comparing options? Take the decision workbook with you.
The ETF Comparison Workbook: TER, domicile, withholding tax and overlap checks in one printable spreadsheet.
What the Fidelity Open World Fund is
The fund is an open-ended investment company (OEIC) in the Fidelity Investment Funds IV umbrella. FIL Investment Services (UK) Ltd manages it. The W-Accumulation share class (ISIN GB00BC7GXN87, SEDOL BC7GXN8) launched on 24 July 2013 and reinvests income. It is also the only share class Fidelity lists for the fund. You can hold it in an ISA, a SIPP or a general investment account.
Fidelity states the objective as: “This Fund targets an average annual return of 7% after the deduction of ongoing fund charges, over a typical market cycle of 5-7 years.” However, it adds that “there is no guarantee that the target will be achieved”. To get there, the fund “provides global exposure to a diversified range of assets (including bonds, equities, alternatives and commodities) by investing at least 70% into funds (including those operated by Fidelity) which may be index tracking funds or actively managed funds”.
So it is not an index fund, and it is not a single-strategy equity fund either. Instead, it is a multi-manager portfolio. Fidelity lists its managers as Caroline Shaw and Chris Forgan. They choose which funds to own and in what proportion. The comparison sector is the Investment Association Global sector.
How to read the 7% target
A return target is not a forecast or a promise. Instead, it tells you what the managers are aiming for and over what period. That helps you judge them later. Two things are worth noticing. First, Fidelity measures the target after the fund’s ongoing charge. So the underlying portfolio has to earn roughly 8% a year before costs to meet it. Second, it is an average over a 5-7 year cycle, which allows for bad years along the way. For example, a fund can fall sharply in one year and still be on track if the following years are strong. So when you review the fund, compare its rolling five-year return with both the 7% target and a cheap global tracker. Do not judge it on a single calendar year.
What it holds
Despite the multi-asset wording in its objective, the portfolio was almost entirely equities at the end of August 2026. Fidelity’s portfolio data (Morningstar methodology, as of 31 August 2026) showed about 91.1% in stocks and 0.07% in bonds. It also showed 10.78% in “other” and a small negative cash position of -1.95%. However, the mix can change, since the managers are free to add bonds, alternatives or commodities.
The ten largest holdings made up 66.83% of the fund:
- iShares S&P 500 Swap ETF USD Acc: 15.25%
- Xtrackers S&P 500 Equal Weight ETF 1C: 8.75%
- Janus Henderson Global Technology Leaders I Acc: 7.31%
- SPDR S&P 400 US Mid Cap ETF: 6.32%
- Invesco European Equity (UK) M Acc: 5.89%
- BF1 Global Unconstrained Equity A USD Acc: 5.46%
- Fidelity Global Dividend W Acc: 5.19%
- BGF US Basic Value I2: 4.75%
- Federated Hermes Asia ex-Japan Equity F GBP Acc: 4.14%
- Artemis UK Select G Acc GBP: 3.78%
The pattern is clear. Low-cost US index ETFs form the core: the S&P 500, an equal-weight S&P 500 and US mid-caps. Then active funds cover technology, Europe, Asia, the UK, value and dividend styles. The US tilt is also significant. In short, you are paying Fidelity to run a core-and-satellite portfolio on your behalf.
Costs: what 1.02% means
The ongoing charges figure (OCF) of 1.02% is the annual running cost Fidelity publishes for this share class. It comes out inside the fund price. Fidelity also lists transaction costs of 0.01% and no performance fee. On top of this, you pay whatever your platform charges.
For comparison, at the time of writing:
- Fidelity Index World Fund P-Acc, Fidelity’s own MSCI World tracker, has an ongoing charge of 0.12%.
- Vanguard FTSE All-World UCITS ETF (VWRP) has an OCF of 0.14% and held 3,784 stocks at 31 August 2026.
- Vanguard LifeStrategy 100% Equity, another all-in-one fund of index funds, charges 0.20%.
On a £10,000 holding, 1.02% is about £102 a year. In contrast, the trackers above cost roughly £12 to £20 a year. Over decades, that gap compounds. So for the Open World fund to be worth it, its manager selection and asset allocation must add around 0.8 to 0.9 percentage points a year over a global tracker. That is after charges, and it is just to break even.
Past performance
Fidelity’s factsheet shows these discrete 12-month returns to 30 June each year, after charges. It compares them with the Morningstar Global Large-Cap Blend Equity category average:

The record is mixed rather than consistently ahead or behind its peers. It did better than the category in the 2022 sell-off year and in the two most recent years. However, it did worse in 2022-23 and 2023-24. Note that the category is an average of active and passive funds, and many of those are cheaper. Past performance is not a reliable guide to future returns. Also, five years is a short window for judging any fund.
Who might choose it, and who should not
The fund could suit you if you:
- want a single fund where a professional team decides the regional mix and picks active managers;
- like the idea of an explicit return target and a flexible mandate that can move into bonds or alternatives;
- already use the Fidelity platform and value keeping everything in one place.
However, it is harder to justify if you believe that low costs are the most reliable edge, as many long-term investors do. A global tracker gives you thousands of companies, market-cap weighting and no manager risk for a fraction of the fee. If you want bonds as well, an all-in-one fund such as a LifeStrategy fund does the job cheaply. So does a two-ETF portfolio. See our comparison of all-in-one portfolios: LifeStrategy vs VWCE.
Cheaper global alternatives
- FTSE All-World trackers (developed and emerging markets). Our guide to the FTSE All-World index explains what they hold. Also, our VWCE review covers Vanguard’s ETF.
- MSCI World trackers (developed markets only), such as Fidelity Index World. See the MSCI World index guide.
- A shortlist for UK investors: our best global ETFs for UK investors compares VWRP, SWDA and others.
Whichever you choose, hold it in an ISA or SIPP where possible, so growth is tax-free.
Frequently asked questions
Is Fidelity Open World a good investment?
It is a diversified, professionally managed global fund with a 7% annual return target over a 5-7 year cycle. However, there is no guarantee of meeting it. Its 1.02% ongoing charge is much higher than global index trackers at 0.12% to 0.20%. So it needs to beat them consistently to justify the cost. Whether that suits you depends on how much you value active management.
What does Fidelity Open World invest in?
Mainly other funds. At 31 August 2026, its largest holdings were US index ETFs: an S&P 500 swap ETF, an equal-weight S&P 500 ETF and a US mid-cap ETF. It also held active funds covering global technology, Europe, Asia ex-Japan, the UK and global dividends. Overall, it was about 91% in equities.
Is accumulation or income better?
Accumulation units reinvest income automatically. That suits investors who are building wealth and do not need cash payouts. Income units, by contrast, pay it out. Fidelity lists only the W-Accumulation class for Open World, and its historic yield was 0.81%. So income is not the point of this fund.
What is the ongoing charge of Fidelity Open World W-Acc?
It is 1.02% a year, according to Fidelity’s factsheet data in September 2026. There are also transaction costs of 0.01% and no performance fee. Platform or account charges are extra, and they depend on where you hold the fund.
Cited sources: Fidelity: Open World Fund W-Acc key statistics, Fidelity: Open World Fund W-Acc portfolio, Fidelity: Open World Fund W-Acc performance, Fidelity: Index World Fund P-Acc key statistics, Vanguard FTSE All-World UCITS ETF factsheet, and Vanguard LifeStrategy 100% Equity factsheet. Verify current fund figures before investing. Educational content, not financial advice.
Not personalised financial advice. Verify your situation with a qualified adviser. Operated by Aurum Digital Marketing LTD (UK), Companies House 15203665.
European UCITS/ETF investor with 11+ years building a global dividend and index portfolio, and founder of Financial Expert Class. I write every guide here from first-hand experience investing across EU brokers and tax regimes — not theory. More about me →