
The FTSE All-Share is the broadest mainstream index of the London stock market. At 28 August 2026 it held 530 companies, which FTSE Russell says capture 98% of the UK’s market capitalisation. In short, it is the FTSE 100, the FTSE 250 and the FTSE SmallCap added together. It is also weighted by company size, so the 100 largest firms make up about 88% of it.
New to ETFs? Start with the free checklist.
- The European ETF Starter Kit — 12 pages: your first fund, a safe low-cost broker and the 7 costliest beginner mistakes
- + 2 bonus PDFs: Comparison Workbook and Dividend Starter Sheet
- + a free lesson from the €147 Masterclass
What the FTSE All-Share index is
The index measures the performance of all eligible companies on the London Stock Exchange’s main market that pass FTSE Russell’s size and liquidity screens. FTSE Russell’s factsheet calls it the best performance measure of the London equity market. As a result, many UK-focused funds use it as their benchmark.
It is also older than the index most people know. It began in 1962 as the FT Actuaries All-Share Index. FTSE then added the FTSE 100 as a sub-index in January 1984 and the FTSE 250 in October 1992. FTSE Russell reviews constituents quarterly, with an annual rebalance in June. In addition, it calculates the index in real time during market hours, in both price and total return versions.
Do not confuse it with the FTSE All-World. The names are close, but the All-World is a global index of thousands of companies across developed and emerging markets. By contrast, this one is UK only.
FTSE All-Share constituents: the three layers
You can think of the index as three layers stacked by size. FTSE Russell’s factsheets, all with data as at 28 August 2026, give the numbers:
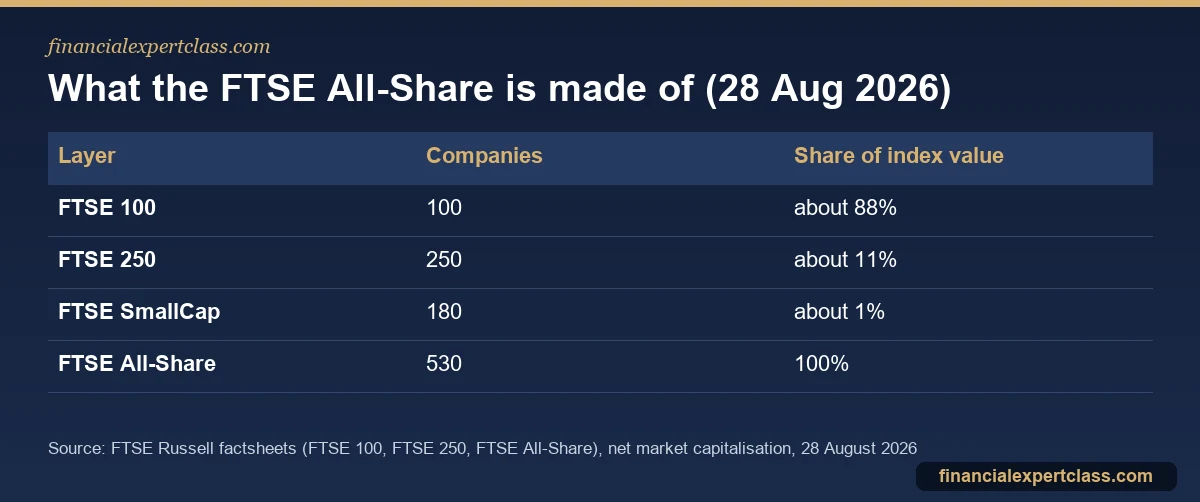
- FTSE 100: the 100 largest companies, with a net market value of about £2.57 trillion.
- The FTSE 250: the next 250 companies, about £317 billion. Together with the FTSE 100 this forms the FTSE 350.
- FTSE SmallCap: 180 smaller companies, about £38 billion.
On a free-float basis, the whole index was worth about £2.92 trillion. “Free float” means only shares that ordinary investors can buy count, so FTSE excludes stakes held by governments or controlling shareholders. Because free-float value sets the weights, the FTSE 100 dominates. So a broad UK tracker instead of a FTSE 100 tracker adds 430 more companies, but only about 12% of extra exposure to mid and small caps.
In August 2026, the ten largest constituents were HSBC (8.96%), Shell (6.41%), AstraZeneca (6.13%), Rolls-Royce Holdings (4.39%) and Unilever (3.44%). Next came British American Tobacco (2.86%), BP (2.76%), Rio Tinto (2.71%), GSK (2.53%) and Barclays (2.31%). Together they made up 42.50% of the index.
Sector breakdown
By ICB industry, the FTSE Russell factsheet shows the index leaning heavily on financials. At 28 August 2026 the split was:
| Industry | Companies | Weight |
|---|---|---|
| Financials | 233 | 30.32% |
| Industrials | 79 | 12.71% |
| Consumer staples | 28 | 12.37% |
| Health care | 12 | 10.47% |
| Energy | 13 | 9.37% |
| Basic materials | 22 | 8.07% |
| Consumer discretionary | 69 | 6.52% |
| Utilities | 9 | 4.24% |
| Technology | 20 | 2.56% |
| Real estate | 40 | 2.09% |
| Telecommunications | 5 | 1.29% |
Technology is only about 2.6% of the UK market. Meanwhile, banks, insurers, investment companies and other financials make up almost a third. That is very different from the technology-heavy US market. It is also one reason UK and US index returns can diverge for years at a time. Many investors therefore hold the UK as one part of a global portfolio rather than on its own.
FTSE All-Share performance and chart
The London Stock Exchange publishes a live chart on its index page, with price and total-return views. At midday on 24 September 2026 the index stood at about 5,770 points. Over the previous 12 months it had ranged between roughly 4,985 and 5,877 (data delayed by at least 15 minutes).
However, index points only show price moves. For investors the better measure is total return, because it includes reinvested dividends. FTSE Russell’s factsheet gives these calendar-year total returns in sterling:

Over longer periods, the factsheet shows a five-year total return of 73.1% to 28 August 2026, or 11.6% a year. The three-year total return was 54.7% (15.7% a year). For the same five years the FTSE 100 returned 85.5% and the FTSE 250 22.5%, so large companies did most of the work. These are historical index figures before any fund costs. Also, past performance does not predict future returns.
On the factsheet date, the dividend yield of the broad index was 3.06%, against 3.05% for the FTSE 100 and 3.78% for the SmallCap index.
FTSE Russell’s historical data for the index is available from July 1962. So the long-run record covers more than six decades of UK market booms, crashes and recoveries. That is far longer than the FTSE 100’s history, which starts in 1984.
How to invest in the FTSE All-Share
You cannot buy the index directly, but several low-cost funds track it. The figures below come from the providers’ own pages in September 2026:
- Vanguard FTSE U.K. All Share Index Unit Trust: a traditional index fund (not an ETF) with an ongoing charge of 0.06%. It held 537 stocks at 31 August 2026, and its accumulation share class had about £13.5 billion of assets. It tracks the index with a representative sample of constituents, and you can hold it in an ISA.
- SPDR UK tracker: the SPDR FTSE UK All Share UCITS ETF is an exchange-traded fund with a total expense ratio of 0.20%. It comes in an accumulating class (ticker FTAL) and a distributing class (ticker FTAD) on the London Stock Exchange.
The practical difference is how you buy. You buy an index fund at one price per day through a fund platform. An ETF, on the other hand, trades like a share during market hours on any broker that offers London-listed ETFs. Our comparison of index funds and ETFs covers the trade-offs. These include platform fees, which can outweigh the fund’s own charge.
If you only want the largest companies, a FTSE 100 tracker gives you about 88% of the same exposure. If you want the UK as part of a wider mix, a global fund already includes UK shares. In that case, see our shortlist of global ETFs for UK investors.
Where it fits in a portfolio
A broad UK tracker is a reasonable core holding for someone who deliberately wants a home bias. That means companies they know, returns in sterling and a dividend yield of around 3% at the time of writing. The downsides are concentration in a few sectors and a small technology weighting. Inside a stocks and shares ISA or SIPP, UK tax does not touch dividends and gains. That matters more for an income-producing fund.
One practical tip: if you already own a global tracker, check how much UK exposure it gives you before adding a UK fund on top. The UK is a small slice of global indices. So a separate UK fund is a deliberate tilt, not a duplicate, but you should size it on purpose rather than by accident.
Frequently asked questions
How many companies are in the FTSE All-Share?
There were 530 at 28 August 2026, according to FTSE Russell: 100 in the FTSE 100, 250 in the FTSE 250 and 180 in the FTSE SmallCap. The number changes at each quarterly review, as companies join, leave or face takeovers.
What is the difference between the FTSE 100 and the FTSE All-Share?
The FTSE 100 is the 100 largest London-listed companies. By contrast, the broader index adds the FTSE 250 and SmallCap to them. But because size sets the weights, the FTSE 100 still makes up about 88% of its value.
Where can I see a FTSE All-Share chart?
The London Stock Exchange’s index page has an interactive chart with price and total-return views, delayed by at least 15 minutes. In addition, FTSE Russell’s monthly factsheet shows a 10-year total return chart and calendar-year returns.
Is there a FTSE All-Share ETF?
Yes. The SPDR FTSE UK All Share UCITS ETF trades in London in accumulating (FTAL) and distributing (FTAD) versions, with a 0.20% TER in September 2026. Vanguard also offers a UK index fund with a 0.06% ongoing charge, which is a unit trust rather than an ETF.
Cited sources: FTSE Russell: FTSE All-Share Indices factsheet (28 Aug 2026), FTSE Russell: FTSE 100 factsheet (28 Aug 2026), London Stock Exchange: FTSE All-Share index page, Vanguard FTSE U.K. All Share Index Unit Trust, and State Street SPDR UCITS ETF range (FTAL, FTAD). Verify current fund figures before investing. Educational content, not financial advice.
Not personalised financial advice. Verify your situation with a qualified adviser. Operated by Aurum Digital Marketing LTD (UK), Companies House 15203665.
European UCITS/ETF investor with 11+ years building a global dividend and index portfolio, and founder of Financial Expert Class. I write every guide here from first-hand experience investing across EU brokers and tax regimes — not theory. More about me →