
The MSCI Emerging Markets Index is the most widely tracked benchmark for emerging-market shares. At the end of August 2026 it held about 1,177 large and mid-sized companies. Taiwan (27.6%), Korea (20.7%), China (20.6%) and India (11.4%) dominate it. European investors buy it through UCITS ETFs such as iShares’ IEEM, with fees from about 0.18% a year.
New to ETFs? Start with the free checklist.
The European ETF Starter Kit: what to check before you buy your first UCITS ETF — domicile, costs, tax and broker set-up.
What the MSCI Emerging Markets Index is
MSCI is the index company behind the MSCI World. It classifies every stock market as developed, emerging or frontier. To do so, it looks at the size of the economy and the size and liquidity of its stock market. It also checks how easy it is for foreign investors to get money in and out. The Emerging Markets Index then covers the large and mid-cap companies in the markets it classes as emerging. It weights them by the value of their freely tradable shares.
At 31 August 2026, the Vanguard Emerging Markets Stock Index Fund, which tracks the index, listed 1,177 stocks in its benchmark. The largest holding was Taiwan Semiconductor Manufacturing (TSMC) at 15.1% of the fund. Next came Samsung Electronics at 8.1% and SK hynix at 5.5%, followed by Tencent and Alibaba. By sector, information technology was 41.9% and financials 19.5% under the GICS system. The fund’s dividend yield was 1.9%.
That mix surprises many people who think of emerging markets as commodity exporters. Today, however, Asian technology manufacturers lead the index, above all the chip-makers of Taiwan and Korea.
Countries: four markets dominate
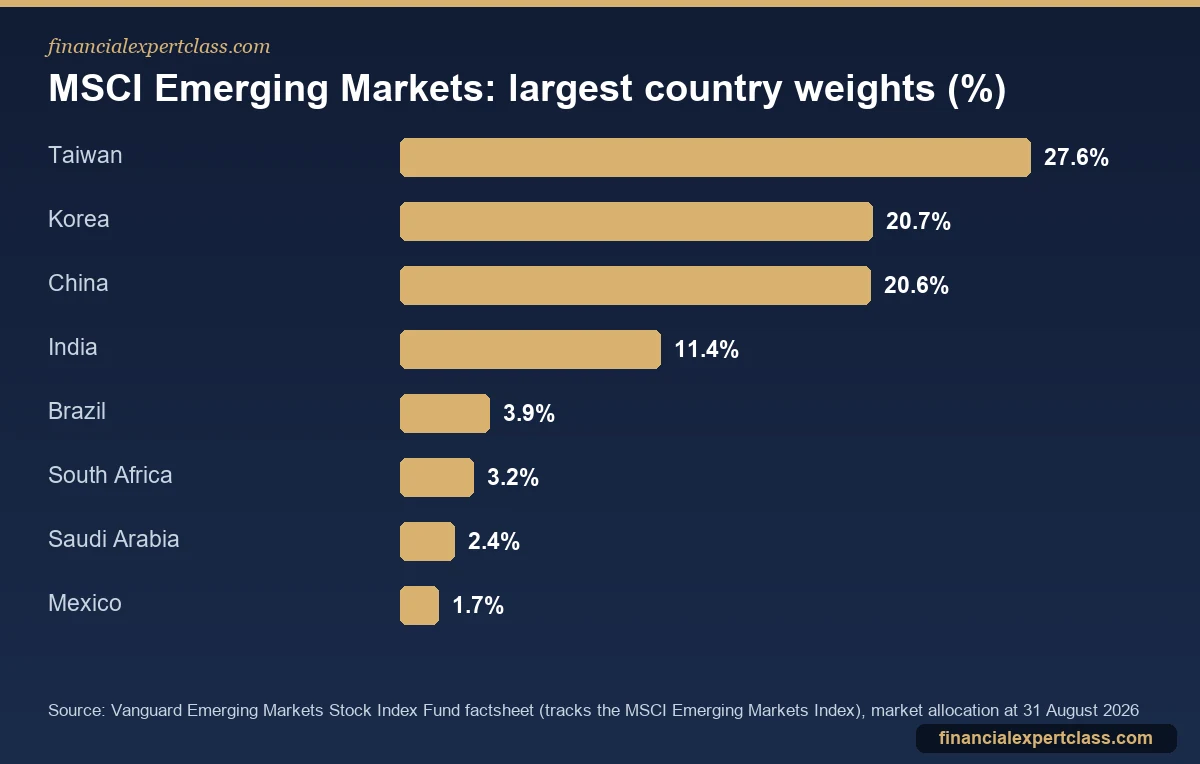
Taiwan, Korea, China and India together make up about 80% of the index. Brazil, South Africa, Saudi Arabia and Mexico are the largest of the rest. The long tail also includes markets such as the United Arab Emirates and Poland. For the Vanguard fund, TSMC alone was 15.1%. So a single company carries more weight than every country outside the top four.
Two practical consequences follow. First, an MSCI EM fund is a big bet on the semiconductor cycle, which also dominates developed-market technology indices. Second, China’s weight means Chinese policy and US-China relations matter a great deal to returns. Our guide to China ETFs for European investors covers that exposure in detail.
MSCI Emerging Markets vs FTSE Emerging
FTSE Russell runs the main competing index family, and the headline difference is Korea. MSCI still classifies South Korea as an emerging market. FTSE, however, treats it as developed, so Korea does not appear in the FTSE Emerging Index at all. That one decision shifts every other weight.

In the FTSE Emerging Index at 31 August 2026, Taiwan was 32.80%, China 27.18% and India 15.69%, with 2,290 constituents. The FTSE version therefore gives you more China and India and no Korea. The MSCI version, by contrast, puts a fifth of your money in Korean companies such as Samsung and SK hynix. Neither is “right”. What matters is consistency with the rest of your portfolio.
For example, your developed-market fund may be FTSE-based, such as a FTSE Developed fund. In that case it already includes Korea, so pairing it with MSCI EM would double-count Korea. Pairing FTSE with FTSE, or MSCI with MSCI, avoids gaps and overlaps. Our explainer on why MSCI and FTSE global funds hold different stocks goes further.
Standard vs IMI: large and mid caps or the whole market
MSCI also publishes an Emerging Markets Investable Market Index (IMI), which adds small companies. The iShares Core MSCI EM IMI UCITS ETF (EIMI) tracks it and held 3,061 stocks at 31 August 2026. By contrast, the iShares MSCI EM UCITS ETF (IEEM), which tracks the standard index, held 1,161. Adding small caps lowers the weight of the giants. For instance, TSMC was 13.31% of EIMI versus 15.17% of IEEM.
For most investors the difference in results is modest, because small caps are a small share of the total value. The IMI version is the more complete picture of emerging markets. The standard version, however, is the one most ETFs and benchmarks use. Our EIMI review and EMIM vs IEMA comparison weigh up the two.
UCITS ETFs that track emerging markets
All figures below are from the providers’ own factsheets dated 31 August 2026.
- iShares MSCI EM UCITS ETF USD (Dist), IEEM: tracks the MSCI Emerging Markets Index; total expense ratio (TER) 0.18%; pays dividends quarterly. It has about $10.3 billion in assets and is ISA-eligible with UK reporting status.
- iShares Core MSCI EM IMI UCITS ETF, EIMI: tracks the MSCI EM IMI (including small caps); TER 0.18%; accumulating. It has about $46.6 billion in assets and is ISA-eligible with UK reporting status.
- Vanguard FTSE Emerging Markets UCITS ETF, VFEM: tracks the FTSE Emerging Index (no Korea); ongoing charges figure 0.17%; distributing quarterly. It lists in London as VFEM in pounds and VDEM in dollars.
Choosing between these often comes down to what happens to the dividends. IEEM and VFEM pay them out every quarter. That suits investors who want income or who reinvest manually. EIMI, on the other hand, accumulates, adding dividends back into the fund automatically, which is simpler for long-term growth. Inside a stocks and shares ISA or SIPP, the choice makes no tax difference.
In a UK general investment account, however, both types are taxable on their income. For accumulating funds with UK reporting status, you still declare the reported income each year, even though you receive no cash. Our guide to accumulating vs distributing ETFs in the UK explains excess reportable income. EU investors should check their own country’s rules, which differ widely.
UK investors who prefer an index fund to an ETF can also use the Vanguard Emerging Markets Stock Index Fund, which tracks the MSCI index. If so, check the charge for the share class your platform offers. For a wider side-by-side of the options, see our best emerging markets ETFs guide.
How much emerging markets should you hold?
There is no fixed rule, but market weight is a useful anchor. Emerging markets are roughly a tenth of global indices such as the FTSE All-World. Also, a global fund like an MSCI ACWI tracker already includes them. If you hold an MSCI World or S&P 500 fund, however, you have none. In that case, adding an EM fund at around a tenth of your equities brings you close to global market weight.
Going well above that is a deliberate bet. Emerging markets have long periods of both outperformance and underperformance, and higher volatility. They also carry currency risk against the pound and the euro. In addition, political risks such as capital controls or sanctions can leave investors unable to trade certain shares. So keep the allocation to a size you can hold through a deep fall.
Frequently asked questions
What is the MSCI Emerging Markets Index?
It is MSCI’s benchmark of large and mid-sized companies in the markets it classifies as emerging, weighted by free-float market value. At 31 August 2026 it had about 1,177 constituents, led by Taiwan, Korea, China and India. Information technology was the largest sector.
What stocks are in the MSCI Emerging Markets Index?
The largest are Taiwan Semiconductor Manufacturing, Samsung Electronics, SK hynix, Tencent, Alibaba and MediaTek. In the Vanguard fund that tracks the index, TSMC alone was 15.1% at 31 August 2026. In addition, the top ten together were about 38% of the fund.
Is MSCI Emerging Markets or FTSE Emerging better?
Neither is better in general. MSCI includes South Korea (about a fifth of the index). FTSE, however, classes Korea as developed and gives more weight to China and India instead. So choose the one that fits your developed-market fund, and you avoid double-counting or missing Korea.
Which ETF tracks the MSCI Emerging Markets Index?
The iShares MSCI EM UCITS ETF (IEEM, TER 0.18%) tracks the standard index. The iShares Core MSCI EM IMI UCITS ETF (EIMI, TER 0.18%) tracks the broader IMI version that includes small caps. Both are ISA-eligible with UK reporting status.
Cited sources: Vanguard Emerging Markets Stock Index Fund factsheet, FTSE Russell: FTSE Emerging Index factsheet, iShares MSCI EM UCITS ETF (IEEM) factsheet, iShares Core MSCI EM IMI UCITS ETF (EIMI) factsheet, and Vanguard FTSE Emerging Markets UCITS ETF factsheet. Verify current fund figures before investing. Educational content, not financial advice.
Not personalised financial advice. Verify your situation with a qualified adviser. Operated by Aurum Digital Marketing LTD (UK), Companies House 15203665.
European UCITS/ETF investor with 11+ years building a global dividend and index portfolio, and founder of Financial Expert Class. I write every guide here from first-hand experience investing across EU brokers and tax regimes — not theory. More about me →