
In the Nasdaq-100 vs S&P 500 choice, the S&P 500 is the broader bet and the Nasdaq-100 the concentrated one. The S&P 500 holds about 500 of the largest US companies from every sector. The Nasdaq-100, by contrast, holds the 100 largest non-financial companies listed on the Nasdaq exchange, with roughly two-thirds in technology. Both are available as low-cost UCITS ETFs. However, the Nasdaq-100 trackers cost more and swing harder.
Comparing options? Take the decision workbook with you.
The ETF Comparison Workbook: TER, domicile, withholding tax and overlap checks in one printable spreadsheet.
Nasdaq-100 vs S&P 500: two very different rulebooks
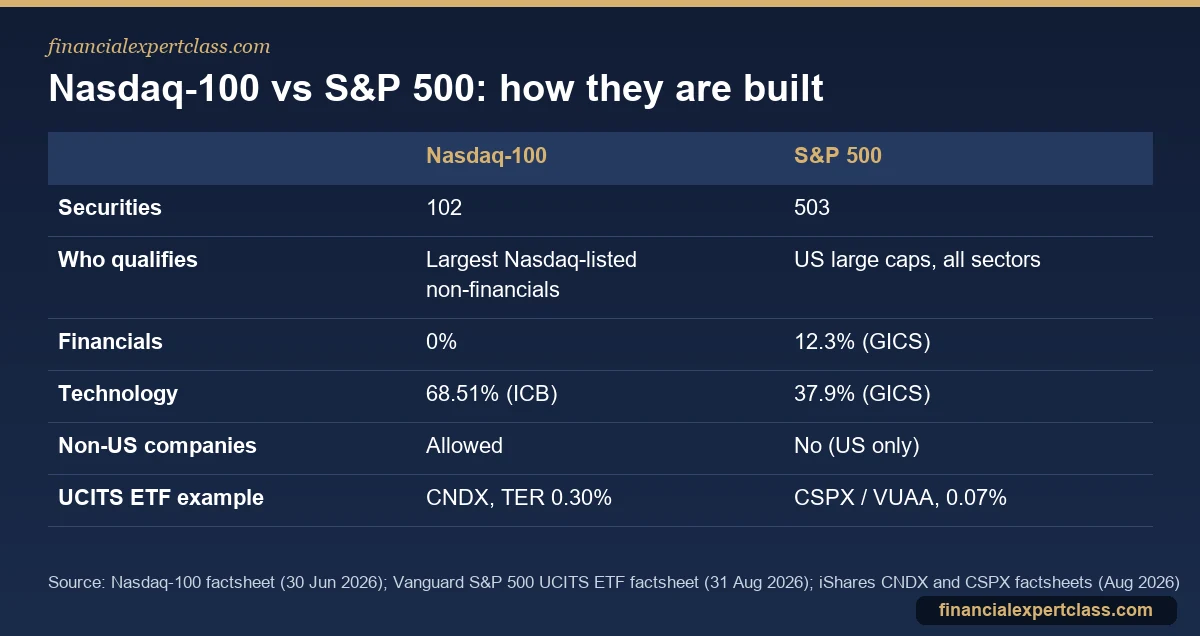
People often say “the Nasdaq” when they mean the Nasdaq-100, a 100-company index that has existed since 1985. It is not the same as the Nasdaq Composite, which is a much broader measure of Nasdaq-listed stocks. Nor is it an index of “tech stocks” by design. Instead, the rule is simple. Take the largest domestic and international companies listed on the Nasdaq Stock Market, and exclude financial companies. Because so many of the world’s biggest technology firms chose to list on Nasdaq, the result is a technology-heavy portfolio. At 30 June 2026 the index had 102 securities, since some companies have two share classes.
S&P Dow Jones Indices runs the S&P 500. It selects around 500 leading US companies across all eleven sectors, whichever US exchange they trade on. As a result, it includes banks, insurers, energy producers and utilities. The Nasdaq-100 leaves these out or holds only small amounts. Vanguard’s S&P 500 ETF factsheet listed 503 stocks in the benchmark at 31 August 2026. Our S&P 500 index guide covers its selection rules in more detail.
Sector concentration: where the two really differ
The Nasdaq-100 factsheet put technology at 68.51% and consumer discretionary at 16.43% of the index at the end of June 2026. Financials, meanwhile, were at exactly zero. That is by design, not by accident.
The S&P 500 is more balanced. Using the GICS system, Vanguard’s factsheet showed information technology at 37.9% and financials at 12.3% (31 August 2026). Next came communication services at 9.5%, health care at 9.3%, consumer discretionary at 9.1% and industrials at 8.3%. The two providers use different sector systems (ICB versus GICS). So the technology numbers are not a perfect like-for-like comparison. Still, the gap is obvious. The S&P 500 has meaningful exposure to banks, energy and industry, and the Nasdaq-100 does not.
Overlap: you already own the Nasdaq giants in the S&P 500
Most of the largest Nasdaq-100 companies are also the largest S&P 500 companies. For example, Nvidia, Apple, Microsoft, Amazon, Alphabet, Broadcom, Micron and Tesla appear in the top ten of both iShares trackers. The difference is how much weight they get. In the iShares Nasdaq 100 UCITS ETF, Nvidia alone was 8.37% of the fund at 31 August 2026. In the iShares Core S&P 500 UCITS ETF, it was 7.93%. Lower down the list, the gap widens, because the smaller index has only 100 names to spread the money across.

That is why holding both indices is not really diversification. Holding both roughly doubles your weight in the same mega-cap technology companies. So if you want more tech on top of a broad core, be aware that is what you are buying. There is also one structural difference. The Nasdaq-100 can include non-US companies listed on Nasdaq, while the S&P 500 is US companies only.
Volatility and risk
Concentration cuts both ways. In one portfolio, two-thirds of the money sits in one sector and almost half in ten stocks. That portfolio will move more sharply than a 500-stock one, in both directions. Nasdaq’s own factsheet shows the index’s price return ranged from a fall of 32.97% in calendar 2022 to a rise of 53.81% in 2023. The S&P 500 also fell in 2022. However, a broader mix of sectors has historically cushioned the extremes.
Past performance tells you what happened when technology led the market. It does not tell you what happens if it lags. We are not going to forecast which index “wins” the next decade. Instead, the practical question is how much concentration you can hold through a bad year without selling.
UCITS ETFs for each index
UK and EU retail investors generally cannot buy US-domiciled funds such as QQQ or VOO. That is because these funds lack the required key information documents. So the route is Irish-domiciled UCITS ETFs.
Nasdaq-100
- iShares NASDAQ 100 UCITS ETF (CNDX): accumulating, total expense ratio (TER) 0.30%, net assets of about $29.9 billion, 102 holdings. It is also ISA-eligible with UK reporting status. Our CNDX review goes through it in detail.
- Invesco EQQQ Nasdaq-100 UCITS ETF: the long-running alternative from Invesco. See our EQQQ review for its costs and share classes.
S&P 500
- iShares Core S&P 500 UCITS ETF (CSPX): accumulating, TER 0.07%, net assets of about $159 billion, ISA-eligible, UK reporting status. It lists in London in USD (CSPX) and GBP (CSP1).
- Vanguard S&P 500 UCITS ETF, accumulating (VUAA / VUAG): ongoing charges figure 0.07%, total assets of about $89 billion across share classes. It lists in London as VUAG in pounds and VUAA in dollars.
Note the cost gap. At the time of writing, the main S&P 500 trackers charge 0.07% a year, while CNDX charges 0.30%. On a £10,000 holding that is £7 versus £30 a year before any platform fees. Our Nasdaq-100 ETF comparison lists the cheaper options available in Europe.
Which should you choose?
For a single core holding, the S&P 500 is the more defensible choice: more companies, more sectors, lower fees. In addition, many investors go one step further and use a global index such as the MSCI World. There, the US is the majority but not the whole portfolio.
The Nasdaq-100 works better as a deliberate satellite. That means a smaller position alongside a broad core, for investors who want extra growth-stock exposure and accept deeper drawdowns. If you do this, decide the percentage in advance, for example a modest slice of your equities. Then rebalance back to it, rather than letting a hot year turn the satellite into the core.
Whichever you pick, use a tax-advantaged account. In the UK, that means a stocks and shares ISA or SIPP; in the EU, it means your country’s equivalent. Also buy the listing in your own currency where possible to avoid broker FX fees. Currency risk against the dollar remains either way, because both indices are US-dollar assets.
Frequently asked questions
Is it better to invest in the Nasdaq or the S&P 500?
Neither is better in every period. The S&P 500 is broader (about 500 companies across all sectors) and cheaper to track. The Nasdaq-100, however, is concentrated in 100 non-financial companies, mostly technology, and has been more volatile. For a core holding most investors choose the S&P 500 or a global index. The Nasdaq-100, by contrast, suits a smaller, deliberate satellite.
Are the Nasdaq and the S&P 500 the same?
No. The Nasdaq-100 is 100 of the largest non-financial companies listed on the Nasdaq exchange, including some non-US firms. The S&P 500 is about 500 leading US companies from every sector and every major US exchange. They share many of the same giant technology companies, but they weight them differently.
Is Apple in the Nasdaq or the S&P 500?
Both. Apple is listed on Nasdaq and is a top holding in both indices. It was 7.47% of the iShares Nasdaq 100 ETF and 7.06% of the iShares Core S&P 500 ETF at 31 August 2026.
Is Nvidia in the S&P 500 or the Nasdaq?
Both. Nvidia trades on Nasdaq and was the largest holding in both at the end of August 2026. It made up 8.37% of the iShares Nasdaq 100 ETF and 7.93% of the iShares Core S&P 500 ETF.
Which UCITS ETFs track the Nasdaq-100 and S&P 500?
For the Nasdaq-100, the iShares NASDAQ 100 UCITS ETF (CNDX, TER 0.30%) and Invesco EQQQ are the best-known. For the S&P 500, the iShares Core S&P 500 (CSPX) and Vanguard S&P 500 (VUAA/VUAG) both charge 0.07% a year.
Cited sources: Nasdaq-100 Index factsheet, Vanguard S&P 500 UCITS ETF factsheet, iShares NASDAQ 100 UCITS ETF factsheet, and iShares Core S&P 500 UCITS ETF factsheet. Verify current fund figures before investing. Educational content, not financial advice.
Not personalised financial advice. Verify your situation with a qualified adviser. Operated by Aurum Digital Marketing LTD (UK), Companies House 15203665.
European UCITS/ETF investor with 11+ years building a global dividend and index portfolio, and founder of Financial Expert Class. I write every guide here from first-hand experience investing across EU brokers and tax regimes — not theory. More about me →