
European investors hunting broad, low-cost exposure to fast-growing economies have plenty of UCITS-compliant ETFs to pick from. Below, we explore the most compelling choices. Moreover, we spotlight their costs, structures and multi-year performance. In addition, we show how you can buy them through Freedom24.
Why Emerging Markets Matter
Emerging markets (EM) now drive roughly 60% of global GDP in purchasing-power terms. They also host many of the world’s fastest-growing consumer bases. For Europeans, EM equities can add return potential and diversification. Notably, their business cycles and sector mixes differ from developed Europe.
Core Screening Criteria
We focused on ETFs that:
-
Track flagship all-country EM indices (MSCI EM, MSCI EM IMI or FTSE Emerging).
-
List in EUR on Xetra or Borsa Italiana for easy Eurozone access.
-
Hold physical portfolios (or transparent DR structures) and carry Total Expense Ratios (TERs) ≤0.22%.
-
Manage at least €800 million to ensure liquidity.
Short-Listed Funds
| Ticker | ETF Name | Index | Listing (EUR) | Replication | Distribution | TER | AuM € bn | Holdings |
|---|---|---|---|---|---|---|---|---|
| IS3N | iShares Core MSCI EM IMI ACC | MSCI EM IMI | Xetra | Full | Accum | 0.18% | 22.971 | 3,107 |
| XMME | Xtrackers MSCI EM 1C | MSCI EM | Xetra/BI | Sampling | Accum | 0.18% | 6.587 | 1,218 |
| VFEM | Vanguard FTSE EM Dis | FTSE Emerging | Xetra/BI | Full | Dist Q | 0.22% | 2.419 | 2,215 |
| VFEA | Vanguard FTSE EM Acc | FTSE Emerging | Xetra/BI | Full | Accum | 0.22% | 0.955 | 2,215 |
| 10AF | Amundi Index MSCI EM DR (C) | MSCI EM | Xetra/BI | Full | Accum | 0.18% | 2.989 | 1,208 |
| AMEM | Amundi MSCI EM (C) | MSCI EM | Xetra/BI | Synthetic | Accum | 0.20% | 2.577 | 1,233 |
| PRAM | Amundi Prime EM Acc | Solactive GBS EM | Xetra | Full | Accum | 0.10% | 0.800 | 4,284 |
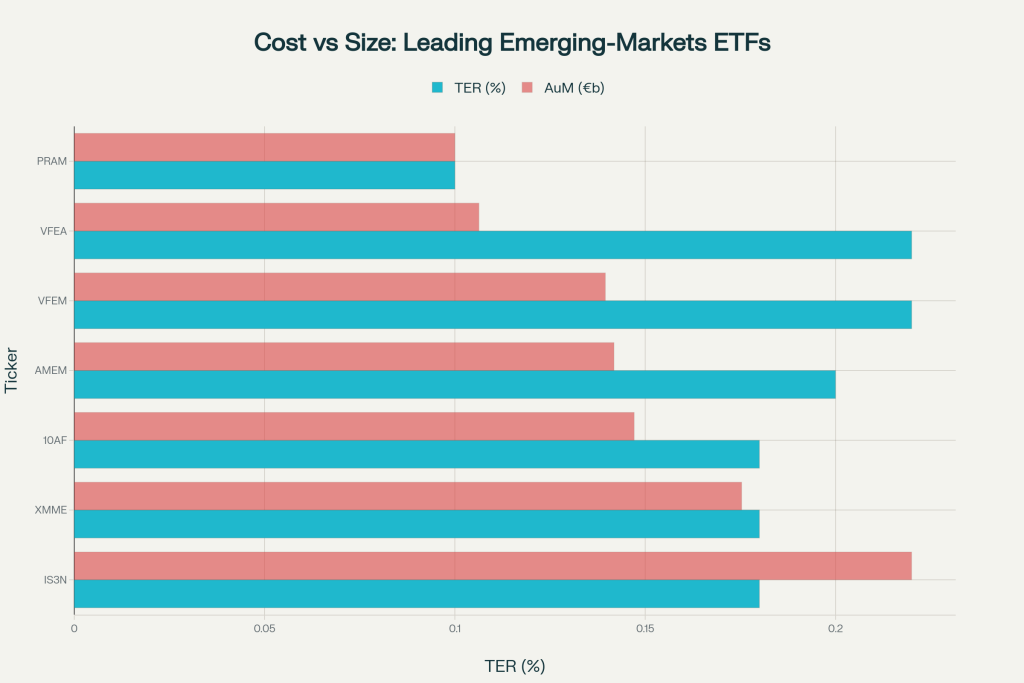
Cost vs Size Snapshot
Key Takeaways
-
iShares IS3N dominates on scale—€22.9 billion—and matches the rock-bottom 0.18% TER of its peers.
-
Amundi Prime PRAM undercuts everyone with a 0.10% TER. However, it remains small, so spreads may widen in stressed markets.
-
Vanguard’s twin share classes (VFEM & VFEA) offer choice between quarterly income or automatic reinvestment.
Deep-Dive Comparisons
Index Breadth
| Index | Large | Mid | Small Cap Coverage | Free-Float Market Cap Coverage |
|---|---|---|---|---|
| MSCI EM IMI | ✓ | ✓ | ✓ | ≈99% |
| MSCI EM | ✓ | ✓ | ✗ | ≈85% |
| FTSE Emerging | ✓ | ✓ | ✗ | ≈90% |
| Solactive GBS EM | ✓ | ✓ | ✗ (but >3,800 stocks) | ≈95% |
For the fullest slice—especially in a long-term core position—IS3N’s IMI coverage stands unrivalled.
Dividend Treatment
-
Accumulating: IS3N, XMME, VFEA, 10AF, AMEM, PRAM reinvest cash automatically. Notably, this stays tax-efficient inside many EU wrappers.
-
Distributing: VFEM pays quarterly, useful for a natural income stream.
Domicile & Tax Efficiency
All funds use Irish or Luxembourg UCITS domiciles. Importantly, Ireland’s double-tax treaties cap US withholding at 15%. This benefits Vanguard and iShares holdings of US-listed ADRs. By contrast, Luxembourg offers similar terms but adds slightly more administrative layers for some markets.
ESG Variants
If you prioritise sustainability screens, Amundi offers an MSCI EM SRI Paris-Aligned version (ticker AMEI, 0.18% TER). Notably, the cost matches core trackers.
Performance Glance (Net € Total Return, 5-yr Annualised)
| Ticker | 5-yr % p.a. | Vol 5-yr | Sharpe 5-yr |
|---|---|---|---|
| IS3N | 5.8% | 16.6% | 0.29 |
| XMME | 5.7% | 16.7% | 0.28 |
| VFEM | 5.4% | 16.0% | 0.27 |
| VFEA | 5.3% | 16.3% | 0.26 |
| 10AF | 5.7% | 17.0% | 0.27 |
| AMEM | 5.5% | 16.5% | 0.27 |
| PRAM* | n/a (launched 2021) | 17.2% | n/a |
Past data confirm near-identical tracking across providers. Notably, variance stems more from index differences than cost spreads. Always remember: past performance is not a reliable indicator of future results.
Practical Considerations
Trading & Liquidity
-
Bid-ask spreads: Typically 0.04%–0.12% on Xetra during core hours for IS3N and XMME. By contrast, PRAM can reach 0.20%.
-
Savings plans: Many German brokers—even low-fee neo-brokers—offer IS3N, XMME, and Amundi 10AF commission-free.
Currency Risk
All ETFs report in USD but trade in EUR. Consequently, investors face exposure to EM currencies and USD/EUR swings. Hedged share classes remain rare and costly. In practice, most investors accept the FX as part of EM risk.
How to Buy via Freedom24
Freedom24 (Freedom Finance Europe) lists all seven ETFs on its multi-exchange platform. After you open an account and pass MiFID suitability, you can:
-
Search the ticker in the Web or Freedom24 mobile terminal.
-
Choose Xetra (DE) or Borsa Italiana (IT) line for tighter EUR spreads.
-
Place a limit or market order. Standard commission runs €2 + 0.02% per trade. Moreover, overnight leverage is optional but carries interest.
Investing is a risk. The forecasts and past performance are not reliable indicators of future performance.
Real-Life Portfolio Examples
Balanced 60/40 Equity Mix
-
60% iShares IS3N for broad EM coverage.
-
40% Vanguard VUAA (S&P 500) to capture developed-market growth.
Estimated blended TER: 0.15%—lower than many active global funds.
Income-Focused Tilt
-
70% Vanguard VFEM (dividends).
-
30% Xtrackers XEMD (quarterly EM income).
Income yield sits near 3% gross while keeping costs at 0.20%.
Which Emerging-Markets ETFs Are Better for Investors Compared to Invesco FTSE All-World and Vanguard FTSE All-World?
When weighing emerging-markets ETFs, investors often compare options like Invesco FTSE All-World and Vanguard FTSE All-World. Crucially, one aspect is the “invesco versus vanguard cost analysis,” which examines management fees and expense ratios. Ultimately, the right choice hinges on an investor’s specific goals and risk tolerance in this dynamic market.
Ultra-Low-Fee DIY Core
-
100% Amundi Prime PRAM (0.10% TER).
Ideal for cost-sensitive long-term savers who can tolerate thinner liquidity.
Final Thoughts
For most European DIY investors, iShares Core MSCI EM IMI (IS3N) remains the strongest one-stop choice. It delivers ultra-low cost, deep liquidity and complete large-mid-small-cap coverage. Moreover, Xtrackers XMME follows as a close second, often trading at similar spreads. By contrast, Vanguard’s FTSE trackers appeal to dividend hunters or brand-loyal investors. Meanwhile, Amundi Prime PRAM sets a new price floor at 0.10% for those comfortable with slimmer assets.
Whichever route you choose, stick to disciplined allocation and rebalance annually. Importantly, remember that emerging markets will test your nerves. Use Freedom24 for swift EUR execution. However, invest only sums aligned with your risk profile and time horizon.
Sources and further reading
- justETF — European UCITS ETF screener
- Morningstar UK ETF rankings
- ESMA — European Securities and Markets Authority
- Bogleheads wiki — EU investing
- ETF.com industry data
Before you open any account
grab the free 12-page Starter Kit: the 7-filter fund shortcut, the 3-question broker safety matrix, and the 7 mistakes that cost beginners the most.

European UCITS/ETF investor with 11+ years building a global dividend and index portfolio, and founder of Financial Expert Class. I write every guide here from first-hand experience investing across EU brokers and tax regimes — not theory. More about me →