
Vanguard vs iShares: Which ETF Provider Should You Choose?
Vanguard or iShares? Decide with the 7-filter workbook.
The free ETF Comparison Workbook gives you the framework and a printable side-by-side template — decide in 15 minutes.
Run the TER through the ETF cost calculator to see the lifetime cost of a fee difference.
Before you commit to a brand, be aware of confirmation bias when choosing an ETF issuer.
See our editorial process and affiliate disclosure.
On the building blocks most European investors actually buy, the two are effectively tied on cost: VUSA and CSPX both charge 0.07% for the S&P 500, Vanguard’s all-world VWCE is 0.14% against iShares’ SSAC at 0.20%, and iShares wins emerging markets with EIMI at 0.18% against VFEM at 0.22%. So fees do not decide it. Range does: iShares lists far more UCITS funds and is stocked by virtually every broker, while Vanguard offers a shorter, simpler line-up from an investor-owned firm. A Vanguard core with iShares satellites is the combination most portfolios end up at, and it is a perfectly good answer. For more detail, see our guide: Vanguard Investor Review.
Choosing between Vanguard and iShares is one of the most common dilemmas facing European ETF investors. Both providers dominate the passive investing landscape. Each offers low-cost index funds that track global markets. However, their philosophies, market positions and fund lineups differ in meaningful ways. Understanding these differences helps you select the provider best aligned with your investment goals, cost sensitivity and preferred index methodology. This guide starts with those two, then places the rest of the European field — Amundi, SPDR, Invesco and Xtrackers — against them, so you can see where each issuer actually earns its slot. For index-level alternatives, see the dedicated VWCE vs alternatives comparison hub.
This comprehensive comparison examines Vanguard and iShares across six critical dimensions. Specifically, we look at company structure and philosophy, European market share, expense ratios, tracking quality, fund selection and liquidity. By the end, you will have a clear framework for deciding. Therefore, you can choose whether to build your portfolio around Vanguard’s VWCE and VUSA (see our roundup of the best Vanguard ETFs for European investors) or iShares’ IWDA and CSPX (compare the best iShares ETFs for European investors). Alternatively, you can intelligently combine both providers where each excels. Further down, the same lens is turned on Amundi, SPDR, Invesco and Xtrackers, followed by a trust checklist you can run against any issuer before you buy.
Company Structure: Investor‑Owned vs Corporate Giant
The fundamental difference between Vanguard and iShares begins with ownership structure. Crucially, this structure shapes everything from pricing philosophy to product development priorities.
Vanguard: The Investor‑Owned Mutual
Vanguard operates under a unique mutual ownership structure. The company is owned by the funds it manages. Those funds, in turn, belong to Vanguard’s investors. In short, when you buy a Vanguard ETF or mutual fund, you become a partial owner of Vanguard itself.
This structure eliminates the profit motive found in traditional asset managers. Vanguard does not need to maximize shareholder returns or pay dividends to external investors. Instead, the firm returns excess profits to fund investors through expense ratio reductions. Over the decades, this has driven Vanguard’s average expense ratios steadily downward. Consequently, long-term investors benefit.
iShares: BlackRock’s ETF Powerhouse
iShares is the ETF division of BlackRock. Notably, BlackRock is the world’s largest asset manager with over $10 trillion in assets under management. BlackRock is a publicly traded corporation (ticker: BLK). Importantly, the firm answers to its shareholders rather than fund investors.
This corporate structure creates a natural tension. On one hand, BlackRock must price competitively to attract assets. On the other hand, it must maintain profitable fee structures to reward equity investors. In practice, BlackRock’s scale advantages – managing trillions across thousands of funds – allow it to offer extremely competitive pricing. Meanwhile, the firm maintains healthy profit margins.
iShares dominates the European ETF market through sheer scale. First-mover advantages in many categories and aggressive product development reinforce that lead. Additionally, the brand benefits from BlackRock’s global infrastructure, regulatory relationships and institutional distribution networks.
European Market Share: Dominance vs Growth
In Europe, iShares and Vanguard occupy very different competitive positions.
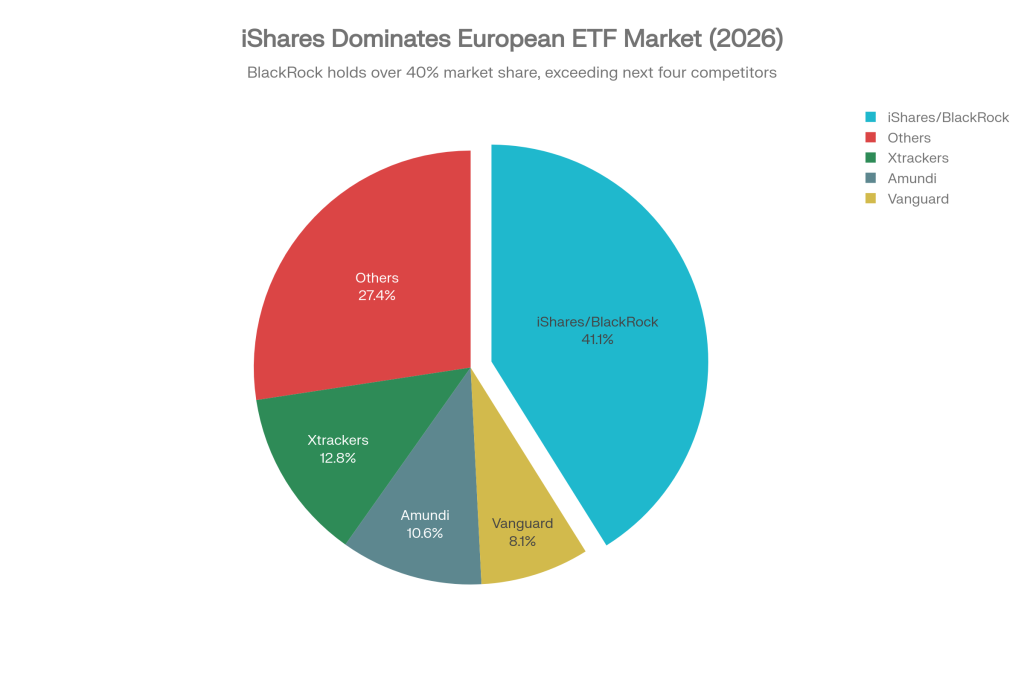
iShares commands 41% of the European ETF market, dwarfing Vanguard’s 8% share despite Vanguard being the second‑largest asset manager globally.
iShares holds a commanding 41.1% market share of European ETF assets as of early 2026. Consequently, it is the clear leader. This dominance reflects BlackRock’s early entry into European ETFs (mid-2000s). Moreover, continuous product innovation across equity, fixed income, commodity and alternative asset classes has cemented the lead.
Vanguard ranks fourth in Europe with roughly 8.1% market share, despite being the world’s second-largest asset manager. The firm entered the European UCITS ETF market later than competitors. In fact, it only launched its first European ETFs in 2012. Vanguard has grown steadily since then. However, the company faces the challenge of competing against iShares’ entrenched distribution relationships and brand recognition.
Expense Ratios: The Cost Battle
Cost matters enormously in passive investing. Every basis point saved compounds over decades into thousands of euros of additional wealth.

Vanguard and iShares expense ratios are nearly identical for most major categories, with marginal differences of 2–4 basis points in competitive funds.
Head‑to‑Head Comparison
| Category | Vanguard Fund | TER | iShares Fund | TER | Winner |
|---|---|---|---|---|---|
| Global Equity | VWCE | 0.14% | IWDA | 0.20% | Vanguard |
| S&P 500 | VUSA | 0.07% | CSPX | 0.07% | Tie |
| Emerging Markets | VFEM | 0.22% | EIMI | 0.18% | iShares |
| Europe | VERX | 0.12% | IMEU | 0.12% | Tie |
| Nasdaq‑100 | N/A | — | EQQQ | 0.30% | iShares (only option) |
The expense ratio battle is remarkably close. For the most popular ETFs tracking S&P 500 and European equities, costs are identical. However, iShares edges ahead in emerging markets (0.18% vs 0.22%), while Vanguard’s 2025–26 fee cuts put VWCE ahead in global equity (0.14% vs 0.20%).
Over a 30-year horizon, the 6-basis-point difference between VWCE and IWDA amounts to roughly €1,800 on a €10,000 initial investment assuming 7% returns — now in Vanguard’s favour. That gap is meaningful but not transformative. Importantly, the key insight is that both providers offer world-class low-cost exposure. Therefore, differences elsewhere often matter more than tiny TER gaps.
Tracking Quality: How Well Do They Follow Indices?
Expense ratios tell only part of the cost story. Tracking difference – the gap between ETF returns and underlying index returns – reveals the true total cost of ownership.
How we compare: fund picks here follow our published ETF comparison methodology — TER, tracking difference, liquidity and domicile, in that order.
Vanguard typically delivers marginally tighter tracking in developed markets (2–5 basis points) versus iShares (3–7bp), though differences are modest and both perform well.
Rates referenced here follow our country-by-country ETF tax table, checked against official sources.
Why Tracking Differences Matter
Tracking difference captures all hidden costs beyond the stated TER:
- Transaction costs from rebalancing and constituent changes
- Cash drag from holding small amounts of uninvested cash
- Index methodology implementation challenges
- Securities lending revenue (which can reduce net tracking difference)
- Tax withholding inefficiencies
Vanguard uses full physical replication and focuses on minimizing trading costs. Consequently, the firm generally produces slightly tighter tracking than iShares. This edge is particularly visible in large developed-market indices. For example, VUSA typically tracks the S&P 500 within 2 basis points annually, compared to CSPX’s 3 basis points.
However, iShares performs better in emerging markets. Its larger scale and securities lending programs offset higher transaction costs. EIMI’s 15-basis-point tracking difference beats VFEM’s 18 basis points. In short, scale advantages can overcome Vanguard’s structural cost focus.
Fund Selection: Breadth vs Focus
iShares offers roughly 400+ UCITS ETFs in Europe. The range spans every conceivable asset class, geography, sector and strategy. By contrast, Vanguard’s European lineup includes approximately 80 funds. Moreover, Vanguard focuses on core index exposures without extensive thematic or factor tilts.
Where iShares Dominates
- Sector and industry ETFs: technology, healthcare, financials, energy – iShares offers granular sector exposure Vanguard does not.
- Smart beta and factor funds: value, momentum, quality, minimum volatility strategies are an iShares specialty.
- Fixed income breadth: corporate bonds, government bonds, inflation‑linked bonds across maturity spectrums and credit qualities.
- Commodity and alternative assets: gold, oil, agriculture, real estate – iShares provides access Vanguard largely avoids.
- Thematic investing: clean energy, robotics, blockchain, cybersecurity and other trend‑focused funds.
Where Vanguard Focuses
Vanguard’s philosophy emphasizes broad market-cap-weighted index funds as the foundation of long-term wealth building. The product lineup reflects this focus:
- Core equity indices (global, regional, country‑level)
- Core fixed income (government and investment‑grade corporate bonds)
- Simple equity and bond blends (LifeStrategy funds in some markets)
Vanguard intentionally avoids most thematic, sector and factor funds. The firm believes active sector rotation and factor timing underperform simple diversification for most investors. This restraint aligns with academic research. However, it limits choice for investors seeking targeted exposures.
Liquidity and Assets Under Management
Larger funds with higher trading volumes offer tighter bid-ask spreads and easier execution for large orders. These advantages matter especially for frequent traders or large portfolios.
iShares ETFs hold significantly larger assets: IWDA €110B vs VWCE €22B, CSPX €89B vs VUSA €44B, reflecting first‑mover advantages and market dominance.
iShares ETFs consistently hold 2–5 times more assets than Vanguard equivalents:
- IWDA (iShares): €110 billion AUM vs VWCE (Vanguard): €22 billion
- CSPX (iShares): €89 billion AUM vs VUSA (Vanguard): €44 billion
- EIMI (iShares): €8.2 billion AUM vs VFEM (Vanguard): €1.8 billion
This size advantage translates into tighter spreads and deeper order books for iShares ETFs. In particular, the gap shows during market stress when liquidity matters most. For small retail investors making monthly contributions of €500–2,000, the difference is negligible. By contrast, investors deploying €50,000+ in single trades will notice iShares’ liquidity advantage.
However, Vanguard’s ETFs are far from illiquid. VUSA with €44 billion AUM and VWCE with €22 billion rank among Europe’s largest ETFs by any measure. In practice, both providers offer institutional-grade liquidity for all but the most enormous trades.
Index Methodology: MSCI vs FTSE
A subtle but important difference lies in index providers. iShares predominantly uses MSCI indices (MSCI World, MSCI Emerging Markets). By contrast, Vanguard often tracks FTSE indices (FTSE All-World, FTSE Developed World).
Key Differences
| Aspect | MSCI (iShares) | FTSE (Vanguard) |
|---|---|---|
| South Korea classification | Emerging market | Developed market |
| Market cap coverage | ~85% of investable universe | ~90–95% (All‑Cap indices) |
| Number of holdings | Fewer (1,500 in MSCI World) | More (4,000+ in FTSE All‑World) |
| Rebalancing frequency | Quarterly | Quarterly |
South Korea’s classification creates the most noticeable difference. MSCI treats South Korea as emerging. Therefore, IWDA (MSCI World) excludes Samsung and Hyundai. Meanwhile, VWCE (FTSE All-World) includes them. Over decades, this affects returns. However, the impact is modest given South Korea’s relatively small weight even in EM indices.
FTSE indices tend to include more small-cap stocks. Consequently, they provide slightly broader diversification. MSCI’s narrower focus on large and mid-caps reduces rebalancing costs and potentially improves tracking. Neither approach is objectively superior – they represent different philosophies about optimal index construction.
Practical Decision Framework
Choose Vanguard if you value:
- Investor‑owned mutual structure aligning incentives
- Marginally tighter tracking in developed markets
- Simplicity and focus on core index funds
- FTSE index methodology (All‑World, All‑Cap coverage)
- Philosophy of avoiding active factor bets
Choose iShares if you want:
- Broadest fund selection including sectors and thematics
- Largest AUM and deepest liquidity
- MSCI index exposure (industry standard)
- Access to smart beta and factor strategies
- One‑stop shop for all asset classes
The Hybrid Approach
Many sophisticated investors combine both providers. Specifically, they choose each where it excels:
- Core equity: VWCE (Vanguard) for all‑world exposure with tight tracking
- S&P 500: CSPX (iShares) for larger AUM and liquidity
- Emerging markets: EIMI (iShares) for lower TER (0.18% vs 0.22%)
- Sector tilts: iShares sector ETFs (technology, healthcare, etc.)
- Fixed income: Mix based on specific maturity and credit needs
This hybrid strategy captures the best of both providers without religious adherence to a single brand. You can execute this approach efficiently through a versatile broker like Interactive Brokers. The platform provides access to both Vanguard and iShares ETFs across European exchanges with low commissions and excellent execution quality.
Tax and Domicile Considerations
Both Vanguard and iShares structure their European ETFs as Ireland-domiciled UCITS funds. As a result, European investors get identical tax treatment. Ireland’s tax treaties recover US withholding tax efficiently (reducing the 30% statutory rate to 15%). Additionally, both providers use accumulating share classes to avoid dividend distribution complications.
From a tax perspective, there is no meaningful difference between Vanguard and iShares. Your home country’s capital gains, wealth and income tax rules apply identically regardless of provider.
Making Your Decision
For most European investors building simple, long-term portfolios, the choice between Vanguard and iShares matters less than consistent contribution discipline. Staying invested through volatility matters even more.
If you prefer a single provider for philosophical or simplicity reasons, choose based on your priorities:
- Philosophical alignment: Vanguard’s investor‑owned structure resonates with some investors despite minimal practical differences.
- Product needs: if you want thematic or sector exposure, iShares becomes necessary.
- Liquidity preference: larger portfolios (€100,000+) benefit from iShares’ deeper markets.
- Index preference: if you have strong views on MSCI vs FTSE methodology, choose accordingly.
If cost is your only consideration, the optimal portfolio mixes both providers. For example, use EIMI (iShares) for emerging markets at 0.18%, VWCE (Vanguard) for all-world at 0.14%, and CSPX (iShares) for S&P 500 at 0.07%. Platforms like Interactive Brokers make multi-provider strategies practical. They offer unified custody, reporting and low transaction costs.
Conclusion: Both Excellent, Choose Based on Your Needs
Vanguard and iShares both deliver world‑class passive investing solutions with negligible cost differences and excellent tracking quality. iShares dominates the European ETF market with 41% market share, the broadest product range and deepest liquidity. Consequently, it is the default choice for investors wanting comprehensive one-stop access to every asset class and strategy.
Vanguard’s investor‑owned structure, marginally tighter tracking in core indices and philosophical commitment to simplicity appeal to purists who value alignment of incentives and want to avoid thematic distractions. The company’s focus on broad market-cap-weighted funds reflects decades of research. Specifically, that research shows simple diversification outperforms complexity for most investors.
The practical recommendation for most European investors is pragmatic eclecticism: choose each provider where it excels rather than committing to a single brand. For example, use iShares for emerging markets (EIMI at 0.18%) and Vanguard for global equity (compare with Invesco FWIA vs Vanguard VWCE) if you prefer FTSE All-World methodology (VWCE). Either provider works for S&P 500 since they are identical at 0.07% (see our deep dive on VUSA vs CSPX). Crucially, focus your energy on asset allocation, contribution discipline and staying invested through downturns. In short, these decisions matter far more than whether your ETF comes from Malvern, Pennsylvania or London, UK.
Securities lending and domicile: deeper provider differences
How each provider runs securities lending
Both Vanguard Europe and iShares (BlackRock) operate securities lending programmes within their UCITS ETF ranges. However, the policies and revenue splits differ. Vanguard’s Irish-domiciled funds historically run a more conservative lending programme. They lend a lower percentage of fund assets and return the majority of the lending revenue to the fund. By contrast, BlackRock’s iShares programme is larger in scale. Moreover, it uses BlackRock’s in-house agent, with revenue typically split between the fund and BlackRock as the lending agent. Both approaches are disclosed in each fund’s annual report and KIID. Additionally, both fall under UCITS V counterparty and collateral rules supervised by the European Securities and Markets Authority.
For most buy-and-hold investors, the practical impact of these differences on net returns is small — usually a few basis points per year. However, the structural difference is worth understanding if you are comparing tracking difference on a like-for-like basis.
Irish vs Luxembourg domicile
Both Vanguard and iShares have shifted the bulk of their European ETF range to Ireland. The reason is straightforward: Irish-domiciled UCITS ETFs benefit from a 15% US dividend withholding tax under the US-Ireland tax treaty. By contrast, the 30% statutory rate would otherwise apply to a Luxembourg-domiciled fund holding US equities. For a global equity ETF where roughly 60% of the index is US-listed, this can be worth 15–20 basis points per year on the US portion. iShares retains a handful of older Luxembourg-domiciled products from the pre-BlackRock DTB Index Change line. However, new launches and core funds are almost exclusively Irish. In practice, the domicile question is effectively neutral between Vanguard and iShares for the most common global, US and developed-world building blocks. Therefore, you should not pick one provider over the other purely on domicile grounds.
Distribution: which Vanguard and iShares ETFs pay income
A common assumption is that iShares offers more distributing share classes than Vanguard. In practice, both providers offer distributing versions of their flagship UCITS ETFs. Specifically, Vanguard offers VWRL (FTSE All-World), VUSA (S&P 500) and VHYL (FTSE All-World High Dividend Yield). Meanwhile, iShares offers SWDA/IWDA pairs, ISF (FTSE 100) and EUDV (EURO STOXX Select Dividend 30). The difference is in breadth. Notably, iShares has more distributing variants across niche themes (single-country, sector, ESG). By contrast, Vanguard concentrates on a smaller set of broad-market distributing funds. If you live in a country that taxes accumulating funds unfavourably (such as the UK with the offshore funds reporting regime, or Germany and Austria with their Vorabpauschale and accumulating-fund rules), confirm reporting status on the justETF provider screener before selecting.
Quantify it before you choose: our free withholding tax and domicile calculator turns the Ireland-versus-Luxembourg question into a euro figure for your holding.
Beyond Vanguard and iShares: the rest of the European provider field
Vanguard and iShares between them cover what most European portfolios need, but four other issuers hold enough UCITS assets to be worth knowing by name — and in a few specific jobs one of them is the better answer. The standings below are directional, drawn from ETF.com Europe issuer rankings, justETF provider screens and Morningstar issuer pages. They move every week, so confirm the live figure on the issuer’s own page before you act on it.
Amundi — the European heavyweight
Amundi is the largest European-headquartered asset manager and sits among the top three European ETF issuers by AUM after absorbing Lyxor in 2022. That merger created the broadest range of any continental issuer, with strong coverage of the ESG, thematic and emerging-market niches that Vanguard and iShares tend to underweight. The flagship Amundi Prime Global UCITS ETF (PRAW) is among the cheapest global equity ETFs in Europe — verify the current TER on the Amundi ETF site and cross-check via justETF.
Amundi is supervised by the French AMF and has a deep continental distribution network across France, Italy, Spain and Germany. The Lyxor integration caused some product renumbering and the occasional ISIN change, but the range has been stable since. If you specifically want a Europe-headquartered issuer, this is the natural choice.
SPDR (State Street) — the dividend specialist
SPDR is the smallest of the three big American issuers in Europe, but it owns the dividend category: the SPDR S&P US Dividend Aristocrats and SPDR S&P Euro Dividend Aristocrats UCITS ETFs are the institutional standard for that exposure. For broad US exposure, the SPDR S&P 500 UCITS ETF (SPY5) is consistently among the cheapest S&P 500 UCITS ETFs in Europe — check the live TER on the SSGA product page or via Morningstar UK. State Street Global Advisors is one of the three largest asset managers in the world and its UCITS lineup is Irish-domiciled under ESMA rules. Full breakdown in the best SPDR ETFs guide.
Invesco — synthetic replication for US exposure
Invesco is the king of synthetic replication for US-exposed UCITS ETFs. The Invesco S&P 500 UCITS ETF (SPXS / SPXP) is swap-based and is arguably the most tax-efficient way for a non-US-resident to hold the S&P 500, because a well-structured swap can avoid the dividend withholding leakage a physical fund cannot. Invesco also runs the strongest commodity ETP range in Europe via Invesco Physical Gold ETC (SGLD) and similar baskets. The funds are Irish- and Luxembourg-domiciled; the synthetic structure adds counterparty risk that daily collateralisation mitigates but does not erase. The best Invesco ETFs guide covers the trade-offs, and the synthetic vs physical replication guide covers the risk itself.
Xtrackers (DWS) — the Xetra-native option
Xtrackers is the ETF brand of DWS, Deutsche Bank’s asset management arm, and sits comfortably in the top tier of European issuers by UCITS AUM. Like Invesco it is a synthetic specialist with solid physical offerings alongside. The flagship Xtrackers MSCI World UCITS ETF 1C (XDWD) is a multi-billion-euro vehicle. DWS is supervised by Germany’s BaFin, with funds domiciled in Luxembourg and Ireland. For German and Austrian investors who trade Xetra as their primary venue and want a locally supervised issuer, Xtrackers is the obvious pick.
Challengers: JP Morgan, HSBC and Fidelity
Three more issuers deserve mention. JP Morgan Asset Management has scaled its active and research-enhanced UCITS range aggressively since 2018 — see the JPMorgan active ETFs analysis. HSBC offers a small but ultra-cheap core range, covered in the HSBC ETFs guide. Fidelity runs a focused income and quality-factor range, covered in the Fidelity ETFs guide. For more detail, see our guide: Fidelity European Fund W-Accumulation (UK) Review.
Which provider for which job
Here is the heuristic I actually use when I open a new sleeve in my own portfolio. It is not advice, and it assumes you have already read the fee and tracking sections above.
Pick Vanguard when
You want a single core global equity holding (VWCE or VWRL) to hold for twenty years. Pick Vanguard when fee discipline matters more than product breadth, when you want a distributing share class for cash-flow reasons, or when you are building a classic three-fund portfolio of global equity, developed European equity and global aggregate bonds. The mutual ownership structure described earlier is the reason you can trust the fee will not creep upward.
Pick iShares when
You need breadth nobody else offers — a specific sector, a niche factor tilt, single-country exposure, short-duration government bonds in a particular currency. iShares almost always has it, usually with the deepest liquidity. Also pick iShares when you want the tightest spreads for large rebalancing tickets, because IWDA and CSPX trade like water.
Pick Amundi when
You want a Europe-headquartered issuer for supervisory reasons, you want a thematic or ESG slice the Americans underweight, or you want one of the cheapest global equity ETFs on the European market. Amundi is also strong in Asian and emerging-market exposure, where Lyxor used to lead.
Pick SPDR when
You are building a dividend sleeve — the Aristocrats range is the institutional default. Also pick SPDR when you want a very cheap S&P 500 UCITS ETF and you do not need synthetic replication for the tax benefit.
Pick Invesco when
You hold US equity in a taxable EU account and want to capture the tax efficiency of synthetic replication, or you want physical gold and commodity-basket exposure that physical equity replication cannot deliver.
Pick Xtrackers when
You are a Xetra-primary trader, you want a German-supervised issuer to diversify across regulators, or you want a synthetic alternative to Invesco for the same S&P 500 tax play. Xtrackers also has strong emerging-market bond coverage.
How to judge any ETF provider: the trust checklist
The TER is on the front page of every factsheet. The signals that actually separate issuers are buried in regulatory filings and historical behaviour. Securities lending policy and the Ireland-versus-Luxembourg domicile question are covered in detail above; these are the remaining checks I run before committing to a fund from an issuer I do not already hold.
History of fund closures
I look at the issuer’s closure rate over the previous five years. Vanguard rarely closes funds — the roster is small and stable. iShares closes a handful each year as it rationalises overlapping products. Amundi has been pruning the post-Lyxor lineup since 2022. SPDR is stable. Invesco and Xtrackers have retired some smaller synthetic products as appetite shifted toward physical replication on the most popular indices. None of that is a red flag on its own, but if the fund I am about to buy has low AUM and the issuer has a history of pruning small funds, I look elsewhere. A closure is not a loss of capital — you are paid out at NAV — but it is an unplanned taxable event in most European jurisdictions, which is precisely what a long-term holder is trying to avoid.
Fee-cut history
I pull the TER history from the issuer’s annual report or the Morningstar fee tab. A flagship that has cut fees twice in five years tells me the issuer competes on cost. A TER that has been flat for a decade tells me the issuer is milking the AUM. Both are useful to know before you commit twenty years of contributions.
ESG credentials and SFDR alignment
If an ESG mandate matters to you, the issuers diverge sharply. Amundi has led UCITS Article 8/9 flows, and its SFDR-aligned range is the broadest in Europe. iShares captures the largest overall flows, but ESG funds have been a modest share of European equity ETF inflows and that share fell as regulation fatigue set in. Xtrackers has pushed its ESG Screened suite hard, with a large share of recent flows going into SFDR-aligned screened products. Vanguard’s ESG range in Europe remains limited, though it grows steadily. Check the SFDR classification on the KID rather than trusting the fund name — the legal background is on the European Commission’s PRIIPs KID page.
Operational resilience and custodian concentration
This one rarely appears in retail comparisons and is worth ten minutes. State Street acts as custodian for a very large share of EU ETF assets, which is a genuine concentration risk at the market level even though your own holdings are segregated at the depositary. The issuers do diversify their administrators — Northern Trust for Vanguard, BNP for Amundi — and if you are running a large portfolio it is reasonable to spread across issuers whose back offices do not all sit on the same platform.
Peer review: the Bogleheads test
The Bogleheads forum, and its non-US investing subforum in particular, is the best source of honest peer review for UCITS products. That community has been pulling fund structures apart for over a decade and flags anything that smells off long before it reaches the mainstream press.
The pre-purchase checklist
- Total cost — TER plus typical spread, minus the securities-lending revenue returned to the fund. The headline TER alone is the wrong number.
- Liquidity — average daily volume and the quality of on-exchange quotes at the time you actually trade, not the headline AUM.
- Tracking difference — validate against the issuer factsheet and an independent source; it is the number that tells you what the fund really cost you.
- Securities lending policy — how much is lent, what collateral is posted, and what share of the revenue goes back to the fund.
- Operational resilience — who the custodian and administrator are, and whether every fund you own shares them.
- Domicile — Irish domicile for US equity exposure, for the treaty rate covered above.
Frequently asked questions
Vanguard vs iShares: which is cheaper on TER for the core building blocks?
On the three most-used building blocks for European investors, the providers are essentially tied. The S&P 500 trackers VUSA (Vanguard) and CSPX (iShares) both charge 0.07%. Additionally, the FTSE All-World VWCE (Vanguard) is 0.14% after its 2025–26 cuts, while iShares’ equivalent MSCI All-Country World SSAC is 0.20%. After tracking difference, they are close, with Vanguard now slightly ahead. For emerging markets, iShares EIMI at 0.18% is cheaper than Vanguard’s VFEM at 0.22%. In short, the headline winner depends on which exposure you buy.
How do Vanguard and iShares securities lending policies compare?
Both providers run lending programmes inside their UCITS ranges. iShares runs a larger, in-house programme via BlackRock as the lending agent. Notably, BlackRock takes a revenue split with the fund. By contrast, Vanguard typically lends a smaller proportion of fund assets and returns the majority of revenue to fund investors. Both are governed by UCITS V collateral and counterparty rules. In practice, the net impact on tracking difference is usually a few basis points per year. Additionally, each fund’s annual report discloses the details.
Who has more AUM in Europe: Vanguard or iShares?
iShares (BlackRock) is the clear leader in the European ETF market. Specifically, it holds roughly 40–45% market share with the broadest product range. Vanguard is the fastest-growing challenger. However, its European ETF AUM remains a fraction of iShares’ book. Updated rankings are published quarterly by ETF.com and the ETFGI European market reports.
Do both providers offer distributing versions of their flagship ETFs?
Yes. Vanguard offers VWRL (FTSE All-World distributing), VUSA (S&P 500 distributing) and VHYL (High Dividend Yield distributing). Meanwhile, iShares offers IWDA/SWDA accumulating with a distributing counterpart, plus a broader set of distributing thematic and dividend ETFs. If you need distributing income for cash-flow planning or for a country that taxes accumulating funds harshly, both providers have you covered for the main exposures.
Irish vs Luxembourg domicile: which provider is better for tax?
Both providers concentrate new UCITS ETFs in Ireland. The reason is the US-Ireland tax treaty 15% withholding rate on US dividends, compared with 30% otherwise. For mainstream global, US and developed-world ETFs, both Vanguard and iShares are Irish-domiciled. Therefore, the domicile question is neutral. A few older iShares funds remain Luxembourg-domiciled. However, check the fund factsheet on the iShares UK individual investor site before buying.
Why is Vanguard not available on every European broker?
Vanguard Asset Management is the European arm of a US firm. Historically, it distributed through a narrower channel of platforms. Brokers such as Interactive Brokers, Trade Republic, Trading 212, Degiro and XTB carry the full Vanguard UCITS range. By contrast, some smaller national brokers carry only a partial list. iShares, as a BlackRock brand, has a longer history with European distributors. Consequently, it is listed on virtually every broker that offers ETFs. If a broker you like does not list a specific Vanguard ETF, an equivalent iShares ETF is almost always available.
Q: Who has better ETF education resources – JPMorgan, Vanguard or iShares?
A: All three publish genuinely solid education, just with different flavours. Vanguard is best at plain-language investing principles — costs, diversification and staying the course. iShares and the wider BlackRock site win on breadth: screeners, index methodology detail and portfolio tools. JPMorgan’s material is strongest on active management and income strategies, reflecting its range. In my view, none of this should drive your fund choice — pick the fund with the right index, cost and domicile, and read everyone’s education for free.
Q: Is Vanguard or iShares better for a first ETF?
A: Either is a sound first choice, and I would not agonise over it. For one-fund simplicity, Vanguard’s FTSE All-World (VWCE) is the classic starter, while the iShares MSCI ACWI (SSAC) does the same job at a similar cost. iShares offers more choice and near-universal broker availability; Vanguard offers a smaller range that is harder to get wrong. Pick whichever your broker carries cheaply in the share class you want, and prioritise starting over brand.
Is BlackRock better than Vanguard?
Neither is better as a firm; they are structured differently and it shows in different places. Vanguard is owned by its own funds, so there is no external shareholder taking a margin, and that ownership model is the reason its fee cuts have historically been passed through rather than banked. BlackRock is a listed company answerable to shareholders, and it uses that scale differently – more funds, deeper liquidity in niche exposures, and a securities-lending programme run in-house with a revenue split. For a buy-and-hold European investor holding broad index funds, neither structure has measurably changed after-fee outcomes. Pick the fund, not the firm.
What is the difference between the Vanguard and iShares S&P 500 ETFs?
Almost nothing that affects your return. VUSA (Vanguard, distributing), VUAA and VUAG (Vanguard, accumulating), CSPX (iShares, accumulating) and VUSD/SPY5 all track the same S&P 500 index, are Irish-domiciled, replicate physically, and charge 0.07% or less. The real differences are the share class – whether dividends are paid out or reinvested, which is a tax question in your country – and which exchange line trades in your account currency, which decides whether your broker charges you an FX conversion. Fund size and spread favour CSPX marginally on the niche listings; neither is a reason to switch if you already hold the other.
Sources and further reading
- Vanguard Asset Management Europe — UK professional product range and annual reporting.
- BlackRock / iShares — Irish-domiciled UCITS ETF prospectuses and KIIDs.
- justETF — European ETF screener and provider comparison data.
- Morningstar UK — independent ETF ratings and tracking-difference analysis.
- ESMA — European UCITS regulatory framework guidance.
Related guides
- JPMorgan Active ETFs — How JP Morgan’s research-enhanced UCITS range compares with the passive big two.
- SPDR vs iShares — How State Street’s SPDR range stacks up against iShares on TER, AUM and tracking quality.
- Best Vanguard ETFs for European Investors — Curated VWCE, VUSA, VWRL, VHYL and bond ETF picks from the Vanguard UCITS range.
- Best iShares ETFs for European Investors — IWDA, EIMI, CSPX, AGGH and the rest of the iShares core lineup ranked.
- VWCE vs Alternatives Hub — All-world ETF comparison hub covering VWCE, SSAC, FWRA and peers.
- Vanguard VUSA vs iShares CSPX — S&P 500 UCITS head-to-head on TER, tracking and distribution policy.
- UCITS vs U.S. ETFs — Why European investors stick with UCITS funds from both Vanguard and iShares.
Vanguard vs iShares: the 30-second verdict
Both are excellent for European investors and the difference rarely decides outcomes. Choose Vanguard for its investor-owned structure and simple all-world funds (VWCE); choose iShares for the widest UCITS range, larger funds and tighter spreads on niche exposures. Many portfolios sensibly hold both — a Vanguard core with iShares satellites. The sections above break down fees, tracking and fund line-ups in detail.
European UCITS/ETF investor with 11+ years building a global dividend and index portfolio, and founder of Financial Expert Class. I write every guide here from first-hand experience investing across EU brokers and tax regimes — not theory. More about me →