
The FTSE 100 vs S&P 500 choice is between two very different bets. The FTSE 100 holds 100 UK-listed giants led by banks, energy, miners and pharma. It has a higher yield (around 3% for the main ETF) and a lower valuation. By contrast, the S&P 500 holds 500 US companies, more than a third in technology. It has a low yield and a much higher price-to-earnings ratio (end of August 2026 data).
Comparing options? Take the decision workbook with you.
The ETF Comparison Workbook: TER, domicile, withholding tax and overlap checks in one printable spreadsheet.
What each index measures
The FTSE 100 is a market-capitalisation weighted index, according to FTSE Russell. It holds the 100 largest companies listed on the London Stock Exchange that pass size and liquidity screens. It launched on 3 January 1984 with a base value of 1,000. FTSE Russell then reviews it quarterly, in March, June, September and December. Our FTSE 100 guide covers the index in more depth.
The S&P 500 covers 500 leading US companies, also weighted by market value. In fact, the US dominates global indices. US companies were 60.12% of HSBC’s FTSE All-World Index Fund at the end of August 2026. See our S&P 500 guide for background.
Both are “large cap” indices, but they capture very different economies and industries. So comparing them is less about which is better and more about what you want your money exposed to.
FTSE 100 vs S&P 500: the numbers side by side
Our S&P 500 figures come from the HSBC American Index Fund. It invests in all the index’s companies in the same proportions. Its factsheet shows 506 holdings ex cash against 500 index constituents. For the FTSE 100, figures come from FTSE Russell’s own factsheet.
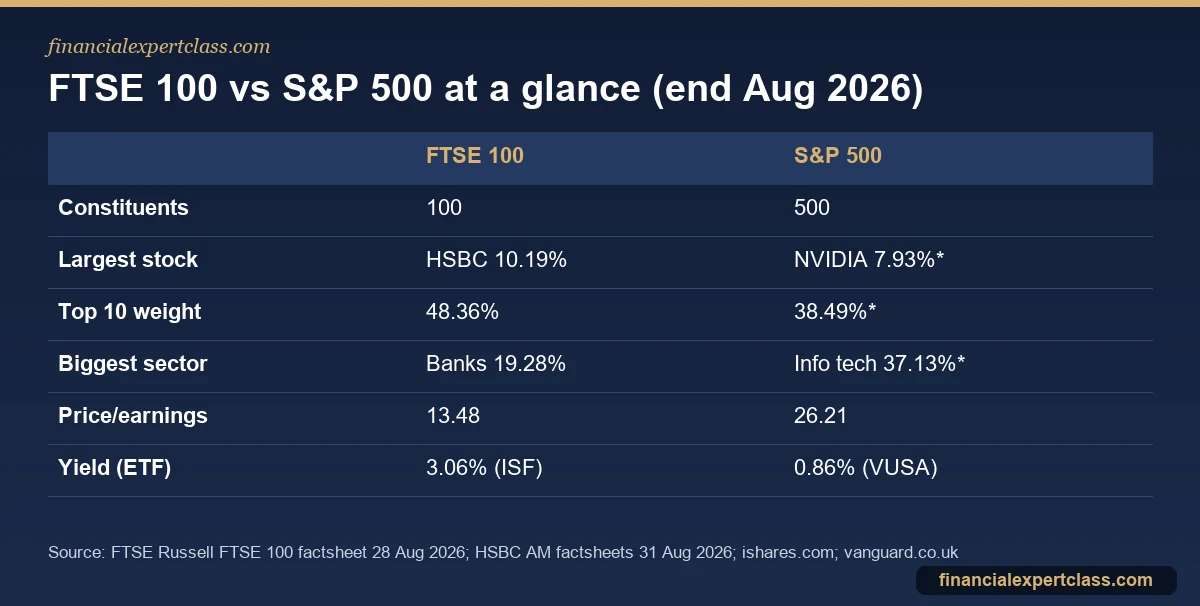
Three things stand out:
- The FTSE 100 is more concentrated. Its top ten companies made up 48.36% of the index on 28 August 2026, and HSBC alone was 10.19%. By contrast, in the S&P 500 fund the top ten were 38.49%.
- Valuations are far apart. HSBC’s factsheets show a benchmark price/earnings ratio of 13.48 for the FTSE 100. For the S&P 500, it was 26.21 at the end of August 2026. In other words, investors pay roughly twice as much per pound of current profit for US shares.
- Income differs. iShares showed a distribution yield of 3.06% for its Core FTSE 100 ETF (ISF) on 22 September 2026. Meanwhile, Vanguard’s distributing S&P 500 ETF (VUSA) showed 0.86% as of 31 August 2026. FTSE Russell gives the FTSE 100 index itself a dividend yield of 3.05%.
Sector mix: old economy vs technology
The biggest difference is what the companies actually do.
Take the FTSE 100 first. FTSE Russell’s supersector breakdown (28 August 2026) puts banks at 19.28% and industrial goods and services at 12.07%. Health care is 11.65%, energy 10.43% and basic resources (mainly miners) 8.41%. However, technology is just 2.53%. The five largest constituents were HSBC, Shell, AstraZeneca, Rolls-Royce and Unilever, together 33.37% of the index.
By contrast, the S&P 500 is the mirror image:

Note that the two sources use different sector systems. FTSE Russell uses the Industry Classification Benchmark (ICB), while the HSBC American fund reports by GICS. Still, the broad picture is clear either way. HSBC’s S&P 500 fund has five top holdings: NVIDIA, Apple, Microsoft, Alphabet and Amazon. All are technology or technology-driven businesses.
This explains much of how the two indices behave. When technology leads, the S&P 500 tends to do better. On the other hand, the FTSE 100 can hold up better when banks, oil and commodities lead. It can also hold up better when expensive growth shares fall out of favour. We do not quote past returns here, because the period you pick changes the answer. Also, past performance does not predict future returns.
Currency: what a UK investor really owns
For a UK investor, currency is an overlooked part of the comparison.
- An S&P 500 fund holds dollar assets. Even if you buy a pound-priced share class, your return still moves with the dollar. It rises when the dollar strengthens against the pound and falls when it weakens. That is extra volatility, but also some diversification away from sterling.
- A FTSE 100 fund trades in pounds. However, many of its largest companies are global businesses that earn much of their revenue overseas and report in dollars. So a weaker pound often flatters the FTSE 100, and it is less of a pure “UK economy” bet than it looks. The FTSE 100 vs Euro Stoxx 50 comparison shows how this plays out against Europe.
UCITS ETFs that track each index
UK investors can hold either index cheaply in a Stocks and Shares ISA. We took the charges below from provider pages and factsheets in September 2026.
| ETF | Index | Charge | Income |
|---|---|---|---|
| iShares Core FTSE 100 (ISF) | FTSE 100 | 0.07% TER | Distributing, quarterly |
| HSBC FTSE 100 (HUKX) | FTSE 100 | 0.07% OCF | Distributing, semi-annually |
| iShares Core S&P 500 (CSPX) | S&P 500 | 0.07% TER | Accumulating |
| Vanguard S&P 500 (VUSA) | S&P 500 | 0.07% OCF | Distributing, quarterly |
ISF is the largest, with net assets of about £16.5 billion on 23 September 2026 and all 100 constituents. Similarly, HSBC’s HUKX fully replicates the index with 101 holdings ex cash. For S&P 500 options in more detail, see our list of the best S&P 500 ETFs.
There is one small UK-specific cost. Buying individual UK shares carries 0.5% stamp duty reserve tax. However, ETFs are exempt from stamp duty on purchase, as Trading 212’s fee page confirms. So owning the FTSE 100 through an ETF avoids that charge.
Which should a UK investor choose?
You do not have to choose. Many UK investors hold a global fund as the core, which already contains both US and UK companies at their market weights. Then they decide whether to tilt towards one. Some practical rules of thumb:
- If you want income and lower valuations, the FTSE 100 is the more natural fit. In return, you accept concentration in a few sectors.
- If you want exposure to growth and technology, the S&P 500 delivers it. In return, you accept a high valuation and heavy reliance on a handful of companies.
- If you want neither bet, a global index spreads you across both and many more markets. Our comparison of S&P 500 vs an all-world portfolio looks at that trade-off.
Frequently asked questions
Is it better to invest in the S&P 500 or the FTSE 100?
Neither is better in all conditions. The S&P 500 is a technology-heavy, higher-valued index of 500 US companies. By contrast, the FTSE 100 is a cheaper, higher-yielding index of 100 UK-listed companies. It is concentrated in banks, energy, miners and pharma. Your choice depends on whether you want growth exposure or income and value. Many investors also hold both through a global fund.
Why does the FTSE 100 have a higher dividend yield?
Its largest sectors, such as banks, oil and gas, miners and consumer staples, traditionally pay out a larger share of profits as dividends. The index also trades on a lower price/earnings ratio: 13.48 versus 26.21 for the S&P 500 at the end of August 2026. A lower price for the same payout means a higher yield.
Is the FTSE 100 worth investing in?
It can be a sensible holding for income and diversification away from US technology. It also costs as little as 0.07% a year through an ETF. The trade-off is concentration: the top ten companies were 48.36% of the index at the end of August 2026.
Can I hold FTSE 100 and S&P 500 ETFs in an ISA?
Yes. The UCITS ETFs listed above, including ISF, HUKX, CSPX and VUSA, are ISA-eligible. So dividends and gains are free of UK tax inside the wrapper.
Cited sources: FTSE Russell: FTSE 100 Index factsheet, HSBC American Index Fund factsheet (S&P 500), HSBC FTSE 100 UCITS ETF factsheet, iShares Core FTSE 100 UCITS ETF, iShares Core S&P 500 UCITS ETF, Vanguard S&P 500 UCITS ETF (Dist), Trading 212: fees incl. stamp duty, and HSBC FTSE All-World Index Fund factsheet. Verify current fund figures before investing. Educational content, not financial advice.
Not personalised financial advice. Verify your situation with a qualified adviser. Operated by Aurum Digital Marketing LTD (UK), Companies House 15203665.
European UCITS/ETF investor with 11+ years building a global dividend and index portfolio, and founder of Financial Expert Class. I write every guide here from first-hand experience investing across EU brokers and tax regimes — not theory. More about me →