
Build the full equity / bond / dividend split inside the asset-allocation builder.
FTSE 100 vs Euro Stoxx 50: Which Index ETF Belongs in Your Portfolio?
For the all-in cost of rebalancing — broker fees plus tax — the rebalance-fee calculator adds them up.
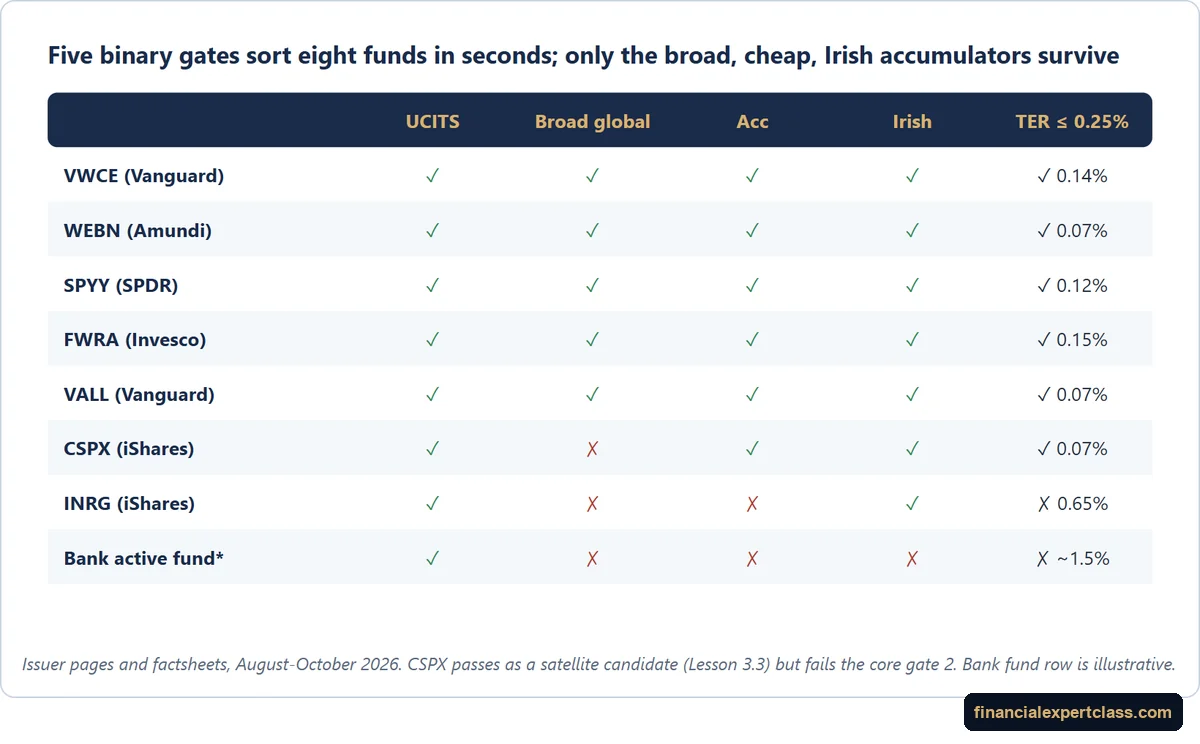
Comparing funds? The 7 filters that shrink 3,000+ ETFs to a shortlist. Run any fund through seven checks in the right order, with worked examples on October 2026 data. The full lesson, free, no sign-up.
European equity exposure presents investors with a fundamental choice. You can concentrate on Britain’s blue-chip powerhouses through the FTSE 100. Alternatively, you can diversify across Eurozone leaders via the Euro Stoxx 50. These indices represent distinct investment philosophies, sector exposures, and geographic risks. Consequently, they profoundly shape portfolio returns and diversification. This comprehensive analysis dissects sector allocations, dividend characteristics, historical performance, and tax considerations. The goal is to determine which European index deserves a place in your strategy. For a wider asset-allocation lens on how these regional sleeves slot together, see our balanced ETF portfolio guide for European investors. Additionally, pair it with the broader European ETF providers comparison if you want to evaluate the issuers behind each tracker. For more detail, see our guide: FTSE 100 vs S&P 500.
Understanding the Core Differences
The FTSE 100 comprises the largest 100 companies listed on the London Stock Exchange by market capitalization. Launched in 1984 with a base level of 1,000 points, the index represents roughly 80% of the UK stock market’s total value. Despite its British domicile, around 75% of FTSE 100 earnings come from international operations. Consequently, the index carries significant currency exposure and global economic sensitivity. Investors can verify constituent weights, sector splits, and dividend yield on the justETF FTSE 100 ETF screener. For more detail, see our guide: FTSE 250 Index.
This analysis sits within our side-by-side ETF comparison.
Our monthly-dividend projection shows the yield-on-cost curve for any starting yield-and-growth combo.
How we compare: fund picks here follow our published ETF comparison methodology — TER, tracking difference, liquidity and domicile, in that order.
The Euro Stoxx 50 tracks 50 blue-chip companies from eight Eurozone countries. These include France, Germany, Netherlands, Spain, Italy, Belgium, Finland, and Ireland. Launched in February 1998, the index captures supersector leaders weighted by free-float market capitalization. Each constituent carries a maximum 10% weighting. This design ensures diversified representation. Moreover, it maintains concentration in Europe’s most influential corporations. Official documentation publishes live methodology and rebalancing rules. For ETF-level data, see Morningstar UK.
Both indices use quarterly rebalancing to maintain constituent quality and market relevance. However, their methods differ. The FTSE 100 reviews membership based on market cap rankings. By contrast, Euro Stoxx 50 selection emphasizes liquidity alongside size. These methodological differences create distinct portfolio characteristics. Over investment horizons, these differences compound significantly. For more detail, see our guide: FTSE AIM All-Share Index.
Index Construction Philosophy
The FTSE 100 operates as a single-country index despite multinational revenue sources. This structure concentrates regulatory risk, currency exposure, and economic policy sensitivity around UK-specific factors. Brexit consequences, Bank of England policy decisions, and British political developments directly influence index performance. This influence applies regardless of constituent companies’ international operations.
By contrast, Euro Stoxx 50’s multi-country composition spreads these risks across Eurozone economies. French luxury goods exporters, German industrial manufacturers, Dutch semiconductor producers, and Spanish banks create diversified exposure to regional strengths. However, this diversification operates within the Eurozone’s shared monetary policy framework. As a result, the index shows correlated responses to European Central Bank decisions.
Sector Allocation: The Defining Distinction
Sector composition represents the most significant structural difference between these indices. The FTSE 100 reflects Britain’s historic strengths in financial services, energy production, and consumer staples. Financials dominate at 23% allocation. Consumer staples follow at 18%, then industrials at 14.5%, healthcare at 11%, and energy at 11%. Technology represents barely 1% of the index. By contrast, this is a stark gap compared to global equity benchmarks.
Euro Stoxx 50 presents a strikingly different profile. Technology commands 18% allocation, driven by ASML Holdings, SAP, and Infineon. Industrials reach 15.4%, while financials represent 18.5%. Moreover, the index provides balanced exposure to consumer goods (11%), insurance (7%), healthcare (6%), and energy (4%). This composition aligns more closely with global economic drivers than the FTSE 100’s traditional sector bias.

The technology differential carries profound implications. FTSE 100 investors miss exposure to semiconductor innovation, enterprise software growth, and digital transformation trends. Notably, these trends drive Euro Stoxx 50 technology holdings. Conversely, FTSE 100’s energy concentration provides inflation hedging. It does so through commodity price sensitivity absent from Euro Stoxx 50’s lighter energy allocation.
Energy and Resources Exposure
The FTSE 100’s 11% energy weighting reflects Shell and BP’s dominant positions. These integrated oil majors generate substantial dividends. However, they face energy transition headwinds and volatile commodity prices. Materials exposure through Rio Tinto, Anglo American, and Glencore adds another 7.4%. Consequently, combined commodity sensitivity exceeds 18%.
Euro Stoxx 50 limits energy exposure to 4.3%, primarily through TotalEnergies. This reduced commodity dependence decreases portfolio volatility during energy price swings. However, it sacrifices inflation protection. The 3.8% materials allocation concentrates in specialty chemicals rather than mining. Despite similar classification, these create fundamentally different economic exposures.
Financial Services Concentration
Both indices carry substantial financial sector exposure, though with different characteristics. FTSE 100 financials emphasize global banking through HSBC, Lloyds, and Barclays. These bring emerging market exposure plus insurance giants such as Prudential and Legal & General. UK regulators oversee these institutions while they generate international revenues.
Euro Stoxx 50 financial allocation splits between banking (11.4%) and insurance (7.1%). German banks like Deutsche Bank join French institutions including BNP Paribas and Société Générale. Additionally, Spanish banks Santander and BBVA create Eurozone-centric exposure. Insurance leaders Allianz, AXA, and Munich Re provide diversification within the financial allocation.
Geographic Diversification: Single vs Multi-Country
Geographic concentration represents the FTSE 100’s most significant limitation. The index provides 100% UK domicile exposure. Therefore, it concentrates political risk, regulatory changes, and economic performance around British outcomes. Although constituent companies operate globally, their listings, governance structures, and primary regulations remain UK-centered.
Euro Stoxx 50 distributes exposure across seven primary countries. France dominates at 39%, reflecting the substantial market caps of LVMH, TotalEnergies, Sanofi, Airbus, and Schneider Electric. Germany contributes 28% through SAP, Siemens, Allianz, and automotive manufacturers. Netherlands provides 14%, primarily via ASML’s semiconductor leadership. Spain, Italy, Belgium, and Finland contribute smaller but meaningful allocations.
This geographic diversification creates distinct risk profiles. Euro Stoxx 50 investors participate in French luxury goods exports, German industrial excellence, Dutch technology innovation, and Spanish banking recovery simultaneously. By contrast, FTSE 100 investors concentrate all regulatory, political, and economic risk in Britain. They do so despite international revenue sources.
Currency Considerations
Both indices trade in their respective currencies — GBP for FTSE 100, EUR for Euro Stoxx 50. However, underlying currency exposures differ dramatically. FTSE 100 companies generate approximately 75% of revenues in non-GBP currencies. Therefore, sterling weakness brings natural benefits. When sterling depreciates, international earnings translate to higher GBP profits, lifting reported results.
Euro Stoxx 50 companies also operate internationally, though with heavier Eurozone revenue concentration. French and German domestic markets plus broader European sales create EUR-denominated revenue streams before global expansion. Currency sensitivity varies by constituent. Nevertheless, aggregate EUR exposure exceeds FTSE 100’s GBP dependence.
Dividend Income: Yield vs Growth
The FTSE 100 earns recognition as one of the world’s premier dividend indices. The current aggregate yield approaches 3.6%. This reflects British market traditions favoring shareholder distributions over growth reinvestment. Financial institutions, energy producers, and consumer staples companies maintain generous payout ratios. As a result, they create reliable income streams for investors. The Vanguard UK product page for VUKE (FTSE 100 UCITS ETF) and equivalents publish historic distribution data.
Historical FTSE 100 dividend performance demonstrates resilience through economic cycles. During the 20-year period from 2003 to 2023, total shareholder returns reached 241%. Dividends rather than capital appreciation drove roughly half of that figure. This 50% dividend contribution significantly exceeds most global indices. Consequently, FTSE 100 attracts income-focused investors.
Euro Stoxx 50 offers more modest dividend yields averaging 2.8%. European companies traditionally prioritize balance sheet strength and growth investment over maximum dividend distributions. Moreover, this lower yield reflects different corporate governance philosophies and shareholder expectations. Continental Europe and Anglo-Saxon markets diverge here.
Dividend Sustainability
FTSE 100 dividend sustainability varies by sector. Energy dividends fluctuate with commodity prices, creating volatility during oil market downturns. Financial sector dividends face regulatory constraints and economic cycle sensitivity. However, consumer staples and healthcare sectors provide stable, growing distributions. These remain insulated from cyclical pressures.
Euro Stoxx 50 dividends show greater stability but slower growth. Industrial companies maintain conservative payouts supporting capacity investment. Technology companies increasingly initiate dividends as they mature, though yields remain modest. The lower aggregate yield reflects sector composition tilted toward growth-oriented industries rather than mature dividend payers. Income-oriented European investors who want a broader survey of options should compare against the best dividend ETFs for European investors hub.
Historical Performance Analysis
Long-term performance comparisons reveal meaningful differences between these indices. Over the past 20 years, the FTSE 100 delivered annualized total returns of approximately 6.3% including reinvested dividends. This moderate performance reflects the index’s mature sector composition, UK economic challenges, and currency volatility impacts.
By contrast, Euro Stoxx 50 achieved stronger long-term performance with annualized returns around 7.2%. Technology exposure, industrial strength, and multi-country diversification contributed to this outperformance. However, the index experienced higher volatility at 16.5% versus FTSE 100’s 14.2%. This reflects greater cyclical sensitivity in constituent sectors.
Recent performance highlights diverging trajectories. The 10-year period ending 2025 saw Euro Stoxx 50 returns reach 118% versus FTSE 100’s 102%. Technology sector strength, European economic recovery, and favorable currency movements supported Euro Stoxx 50 outperformance. Notably, the 5-year comparison shows even starker divergence at 58.5% versus 19.5%. Technology leadership during the digital acceleration period drove this gap.
Crisis Performance Characteristics
During the 2008 financial crisis, both indices suffered severe drawdowns exceeding 40%. The FTSE 100’s financial sector concentration amplified losses as British banks faced existential threats. By contrast, Euro Stoxx 50’s broader sector diversification provided modest mitigation. Even so, Eurozone banking sector weakness still created substantial losses.
The 2020 pandemic crash revealed different resilience patterns. FTSE 100 declined 33% due to energy sector collapse and financial sector stress. Euro Stoxx 50 fell 35% but recovered faster. Notably, it benefited from technology holdings that thrived during lockdowns. The subsequent recovery trajectories diverged significantly. Euro Stoxx 50 reached new highs while FTSE 100 remained below pre-pandemic peaks for extended periods.
ETF Implementation and Costs
Numerous ETF providers offer exposure to both indices with varying cost structures and distribution policies. FTSE 100 ETFs typically charge expense ratios between 0.07% and 0.20% annually. Popular options include iShares Core FTSE 100 UCITS ETF (0.07% TER), Vanguard FTSE 100 UCITS ETF (0.09% TER), and HSBC FTSE 100 UCITS ETF (0.07% TER). For full KIDs and prospectuses, see iShares UK.
Euro Stoxx 50 ETFs operate in similar cost ranges. The iShares Core Euro Stoxx 50 UCITS ETF charges 0.10% TER. Meanwhile, Xtrackers Euro Stoxx 50 UCITS ETF costs 0.09%. Both accumulating and distributing versions exist. Therefore, investors can choose dividend treatment matching their tax circumstances and income requirements. Compare them side-by-side using the justETF Euro Stoxx 50 ETF screener.
Most FTSE 100 and Euro Stoxx 50 ETFs use physical replication, purchasing actual index constituents. This approach ensures tight tracking with minimal tracking error, typically under 0.15% annually. Securities lending programs generate additional revenue offsetting some costs. However, lending introduces modest counterparty risks despite collateralization requirements. The EU sets UCITS rules on lending, collateral, and diversification through ESMA.
Tax Considerations for Investors
UK investors face different tax treatments depending on index selection. FTSE 100 ETFs generate UK dividend income. Standard dividend tax rates apply after the £500 annual allowance. Euro Stoxx 50 ETFs produce foreign dividend income with identical UK tax treatment. However, they require tracking foreign withholding taxes where applicable.
Investors in accumulating ETFs defer income tax until eventual sale. At that point, capital gains tax applies to total appreciation. This structure suits accumulation phases, maximizing compound growth. By contrast, distributing ETFs provide quarterly or annual cash flows. These generate immediate income tax obligations. Even so, they supply actual spending money without forced liquidations.
Portfolio Integration Strategies
Choose FTSE 100 if you prioritize high dividend income. The same logic applies if you want exposure to British multinational revenue streams, seek energy and materials sector weightings for inflation protection, prefer lower volatility through defensive sector concentration, or implement UK home bias strategies acknowledging geographic concentration risks.
Choose Euro Stoxx 50 if you desire technology sector exposure unavailable in UK markets. Additionally, choose it if you value multi-country European diversification, prioritize capital appreciation over immediate income, seek industrial and consumer goods leadership, or want alignment with continental European economic growth dynamics.
Consider combining both indices to maximize European market coverage. A 50/50 allocation provides balanced UK and Eurozone exposure. Moreover, it diversifies sector concentrations and averages dividend yields around 3.2%. This approach mitigates single-country political risks while maintaining European economic participation.
Global Portfolio Context
Within globally diversified portfolios, European indices typically represent 15-25% of equity allocations. The UK makes up approximately 4% of global market capitalization, while the Eurozone contributes around 8%. Overweighting either FTSE 100 or Euro Stoxx 50 beyond these market-cap proportions is an active regional bet. Therefore, it requires justification.
Many investors implement home bias favoring their domicile market. British investors overweight FTSE 100 for currency matching and familiarity. European investors emphasize Euro Stoxx 50 for similar reasons. However, excessive home bias sacrifices diversification benefits and concentrates risks unnecessarily. Balancing home bias against global diversification remains an ongoing portfolio management challenge. Notably, the Bogleheads three-fund portfolio wiki summarises the classic boglehead view of regional vs global weighting.
Rebalancing and Index Changes
Both indices rebalance quarterly to maintain constituent quality and weights. The FTSE 100 conducts market capitalization reviews at quarterly intervals. It adds companies that rise above position 90 and removes those falling below position 111 in the FTSE All-Share rankings. These mechanical rules minimize subjective judgment. Moreover, they ensure quality maintenance.
Euro Stoxx 50 employs buffer zones reducing turnover. Companies must rank 40th or higher to enter. Meanwhile, existing constituents remain unless falling below 60th position. This buffer reduces unnecessary trading costs while maintaining index quality. Additionally, fast-exit rules remove companies following mergers, bankruptcies, or regulatory changes regardless of rebalancing schedules.
Impact on ETF Tracking
Index rebalancing creates transaction costs for physical replication ETFs. Quarterly turnover typically ranges from 2-5% annually for both indices. Fund managers minimize tracking error by anticipating changes, trading during liquid market periods, and optimizing execution strategies. Well-managed ETFs absorb these costs while maintaining tracking errors under 0.15% annually.
Dividend reinvestment timing also influences tracking performance. Distributing ETFs accumulate dividends in cash until distribution dates. Consequently, cash drag reduces returns. By contrast, accumulating ETFs reinvest dividends immediately, eliminating this drag. However, the trade-off may be potentially higher prices during automated reinvestment windows.
Market Capitalization and Liquidity
The FTSE 100’s total market capitalization exceeds £2 trillion, representing substantial economic value. However, concentration in five companies — AstraZeneca, Shell, HSBC, Unilever, and Rolls-Royce — accounts for approximately 31% of total index weight. This concentration creates single-stock risks. As a result, individual company developments significantly impact overall index performance.
Euro Stoxx 50’s market cap approaches €1.5 trillion distributed more evenly across constituents. The top ten holdings represent 48% of index weight, marginally higher than FTSE 100’s 45%. ASML’s 8% weighting as the largest constituent limits single-stock concentration. At the same time, it maintains semiconductor sector exposure. SAP, Siemens, and LVMH provide substantial weights without dominating index movements.
Trading Liquidity Considerations
Both indices support highly liquid ETF trading. FTSE 100 ETFs trade millions of shares daily across London Stock Exchange and other European venues. Bid-ask spreads remain tight during UK trading hours, typically 2-4 basis points for large institutional-grade ETFs. Retail investors trading smaller amounts face negligible execution costs during normal market conditions.
Euro Stoxx 50 ETFs enjoy similarly robust liquidity across multiple exchanges. German Xetra, Euronext Paris, and other venues provide continuous pricing and tight spreads. Notably, the index plays a major role as Europe’s premier derivatives underlying. Eurex futures and options rank among the world’s most actively traded equity index derivatives. Consequently, this ensures deep institutional liquidity supporting ETF creation and redemption mechanisms.
Pairing FTSE 100 or Euro Stoxx 50 With a Global Core
Most European DIY investors I speak with already hold a global core position such as VWCE or IWDA. They add this before layering on regional sleeves. In that context, a FTSE 100 or Euro Stoxx 50 ETF works best as an overlay rather than a standalone portfolio. The key question becomes: how much active regional risk am I willing to add on top of market-cap weights? A common Boglehead-style answer is to cap that overlay at 5-10% of total equity allocation. That range is large enough to feel the dividend or sector tilt but small enough to avoid derailing your global diversification.
If your goal is yield, a FTSE 100 distributing ETF such as ISF or VUKE pairs cleanly with an accumulating global core. Therefore, you can ringfence the dividend cash flow. If your goal is concentrated Eurozone-large-cap technology and industrial exposure, an Euro Stoxx 50 accumulating tracker such as SX5E or EXSA can sit alongside an MSCI World accumulating ETF. The overlap is meaningful but not extreme, so you avoid doubling up on the same constituents in a problematic way. Either way, the more important decision is how this fits inside the overall balanced ETF portfolio framework, not which of the two indices is “better” in isolation.
Common Mistakes European Investors Make With Regional ETFs
Mistake 1: treating either index as a complete portfolio. Both the FTSE 100 and the Euro Stoxx 50 are extreme concentrations — 100 and 50 stocks respectively. As a sole equity holding, they fail the basic diversification test that a globally diversified UCITS ETF passes by default.
Mistake 2: chasing yield without checking sector concentration. The FTSE 100’s headline 3.6% yield is appealing. However, it comes packaged with heavy energy, banks, and miners exposure. Investors who only see the yield often miss a key fact. They are taking a leveraged bet on UK financials and commodity prices.
Mistake 3: ignoring distribution vs accumulation taxation in your country. A Lithuanian, German, or Spanish investor will face very different tax treatment on distributing vs accumulating versions of the same index. Always check your local tax treatment before locking in a 10-year buy-and-hold ETF position.
Mistake 4: forgetting currency. A EUR-based investor buying a GBP-denominated FTSE 100 ETF still carries sterling exposure. This holds even if the broker shows the quote in EUR. Over multi-year horizons, currency translation can dwarf TER differences.
Mistake 5: rebalancing too aggressively. Adding a regional tilt and then panic-trimming it after one bad year defeats the purpose. If you genuinely want a regional overlay, commit to it through at least one full economic cycle.
The Verdict: Choosing Your European Exposure
Neither the FTSE 100 nor Euro Stoxx 50 emerges as universally superior. Your optimal choice depends on investment objectives, income requirements, sector preferences, and geographic diversification priorities within your broader portfolio context.
FTSE 100 excels for income-focused investors seeking reliable dividend streams. It also serves those who want British market exposure with international revenue sources. Additionally, it offers defensive sector positioning through healthcare, consumer staples, and utilities. The 3.6% yield provides substantial cash flow supporting retirement income strategies or reducing portfolio withdrawal rates.
Euro Stoxx 50 wins for growth-oriented investors prioritizing capital appreciation, technology sector participation, and multi-country European diversification. Moreover, the superior long-term performance track record, broader industrial base, and alignment with digital economy trends create compelling accumulation-phase advantages. These benefits hold despite lower immediate income.
Combining both indices offers compelling middle-ground solutions. A balanced allocation captures income and growth characteristics. It also diversifies across UK and Eurozone economies and provides comprehensive European market exposure. This combined approach mitigates individual index weaknesses while preserving sector and geographic diversification benefits.
Ultimately, European equity allocation forms one component within globally diversified portfolios. Maintaining appropriate overall European exposure while balancing North American, Asian, and emerging market allocations matters more than perfecting FTSE 100 versus Euro Stoxx 50 selection. Execute your choice decisively, maintain consistent contributions, and focus energy on factors generating larger portfolio impacts than this binary regional decision.
FAQ: FTSE 100 vs Euro Stoxx 50 ETFs
Is the FTSE 100 better than the Euro Stoxx 50 for European investors?
Neither index is universally better. The FTSE 100 has historically offered a higher dividend yield (around 3.6%) and heavier defensive sector exposure. By contrast, the Euro Stoxx 50 has delivered stronger 10-year total returns thanks to its 18% technology weighting. The right choice depends on whether you prioritise income or growth, and how either fits inside your global core allocation.
Are FTSE 100 and Euro Stoxx 50 ETFs UCITS-compliant?
Yes. The main ETFs tracking these indices — including iShares Core FTSE 100 UCITS ETF, Vanguard FTSE 100 UCITS ETF, iShares Core Euro Stoxx 50 UCITS ETF, and Xtrackers Euro Stoxx 50 UCITS ETF — are UCITS-compliant Ireland or Luxembourg domiciled funds. The EU UCITS framework regulates them, with supervision from ESMA and national regulators such as BaFin and the Central Bank of Ireland.
What is the dividend yield difference between FTSE 100 and Euro Stoxx 50?
The FTSE 100 currently yields approximately 3.6% versus around 2.8% for the Euro Stoxx 50. That ~0.8 percentage-point gap reflects two factors. The FTSE leans on mature dividend payers (energy, banks, consumer staples). Meanwhile, Continental Europe shows a stronger preference for reinvestment over distribution.
Can I hold both FTSE 100 and Euro Stoxx 50 ETFs at the same time?
Yes, and many European investors do exactly that. A 50/50 split between the two indices produces a blended yield of roughly 3.2%. Moreover, it offers broader sector and country diversification than either index in isolation. However, be aware you are still concentrating in European large caps. Therefore, you should pair this with a global core position.
How are FTSE 100 and Euro Stoxx 50 ETF dividends taxed for EU investors?
Tax treatment depends on three factors: (a) the ETF’s domicile, (b) its distribution policy (distributing vs accumulating), and (c) your country of tax residence. Ireland-domiciled UCITS ETFs benefit from the US-Ireland treaty rate of 15% on US dividends. Consequently, they are tax-efficient for most EU residents. Always check your local tax authority’s guidance and the ETF’s KID before purchase. Importantly, this article is educational and not tax advice.
Which FTSE 100 UCITS ETF has the lowest total expense ratio?
iShares Core FTSE 100 UCITS ETF (ISF) and HSBC FTSE 100 UCITS ETF both charge 0.07% TER, the lowest in the category. Vanguard FTSE 100 UCITS ETF (VUKE) charges 0.09%. Cost differences are small in absolute terms. Therefore, distribution policy, fund size, and liquidity should also factor into your selection.
Is the FTSE 100 too concentrated in five stocks?
The top five FTSE 100 constituents — AstraZeneca, Shell, HSBC, Unilever, and Rolls-Royce — account for roughly 31% of index weight. That is meaningful single-stock concentration. However, the global revenue mix of these companies partly offsets the risk. The Euro Stoxx 50’s top five carry similar concentration, with ASML alone at around 8%.
Where can I check live FTSE 100 and Euro Stoxx 50 ETF data?
Use independent sources. For European UCITS ETF data and KIDs, try justETF. Morningstar UK provides ratings and historical performance. Additionally, the issuer pages of Vanguard and iShares offer official factsheets and prospectuses.
Sources and further reading
- justETF — European UCITS ETF database
- Morningstar UK — ETF ratings & historical data
- Vanguard UK — VUKE FTSE 100 UCITS ETF
- iShares UK — ISF FTSE 100 & Core Euro Stoxx 50 UCITS ETFs
- ESMA — UCITS regulatory framework
- Bogleheads — Three-fund portfolio and regional weighting
Educational content, not personalised investment advice. The author is an independent European ETF investor (11+ years), not an FCA-regulated adviser. Always read the KID/KIID and consult a qualified adviser before investing. See our editorial process and affiliate disclosure.
Sources and further reading
- justETF — European UCITS ETF screener
- Morningstar UK ETF rankings
- ESMA — European Securities and Markets Authority
- Bogleheads wiki — EU investing
- ETF.com industry data
European UCITS/ETF investor with 11+ years building a global dividend and index portfolio, and founder of Financial Expert Class. I write every guide here from first-hand experience investing across EU brokers and tax regimes — not theory. More about me →