
The FTSE 250 is the index of the 250 largest UK-listed companies below the FTSE 100, the UK’s mid-caps. As at 28 August 2026, its constituents were worth £317 billion in total. The average size was £1.27 billion, and the dividend yield was 3.05%. Compared with the large-cap index, it is heavier in financials, industrials and consumer businesses. You can also track it cheaply with ETFs such as VMID.
New to ETFs? Start with the free checklist.
The European ETF Starter Kit: what to check before you buy your first UCITS ETF — domicile, costs, tax and broker set-up.
What the FTSE 250 is
FTSE Russell says the index represents “mid cap stocks traded on the London Stock Exchange (LSE), which pass screening for size and liquidity”. In practice, these are the next tier of companies below the FTSE 100. FTSE Russell also describes the FTSE All-Share as the sum of three parts: the large caps, the mid caps and the FTSE Small Cap index.
Key facts from the FTSE Russell factsheet:
- Launched: 12 October 1992, with history calculated back to 31 December 1985.
- Weighting: free-float market capitalisation (only shares genuinely available to trade), with liquidity screening.
- Reviews: quarterly, in March, June, September and December. At these reviews, companies move between the two indices as they grow or shrink.
- Calculation: price and total-return versions, in real time and end of day, in GBP and EUR.
This page is part of our UK index series. The large-cap companion is our FTSE 100 index guide.
Size and concentration
However, the mid-cap index is far less concentrated than the large-cap one. At 28 August 2026, the largest constituent was only 1.34% of the index, and the top 10 together were 12%. Meanwhile, the median company was worth £971 million and the smallest £93 million.
The ten largest constituents were:
- easyJet (travel and leisure): 1.34%
- Balfour Beatty (construction and materials): 1.34%
- WPP (media): 1.30%
- Rotork (electronic and electrical equipment): 1.24%
- Rightmove (real estate services): 1.21%
- Mondi (general industrials): 1.20%
- RS Group (industrial support services): 1.12%
- Man Group (investment banking and brokerage): 1.12%
- Rosebank Industries (electronic and electrical equipment): 1.08%
- JPMorgan Global Growth & Income (closed-end investment): 1.06%
So no single company can move the index much. The last name also highlights a quirk. It includes closed-end investment companies (investment trusts), which are themselves funds holding other shares.
Sector mix: how the FTSE 250 differs from the FTSE 100
Above all, the industry split is where the mid-caps really stand apart. So the easiest way to see it is against the FTSE All-Share, where large-cap companies dominate.
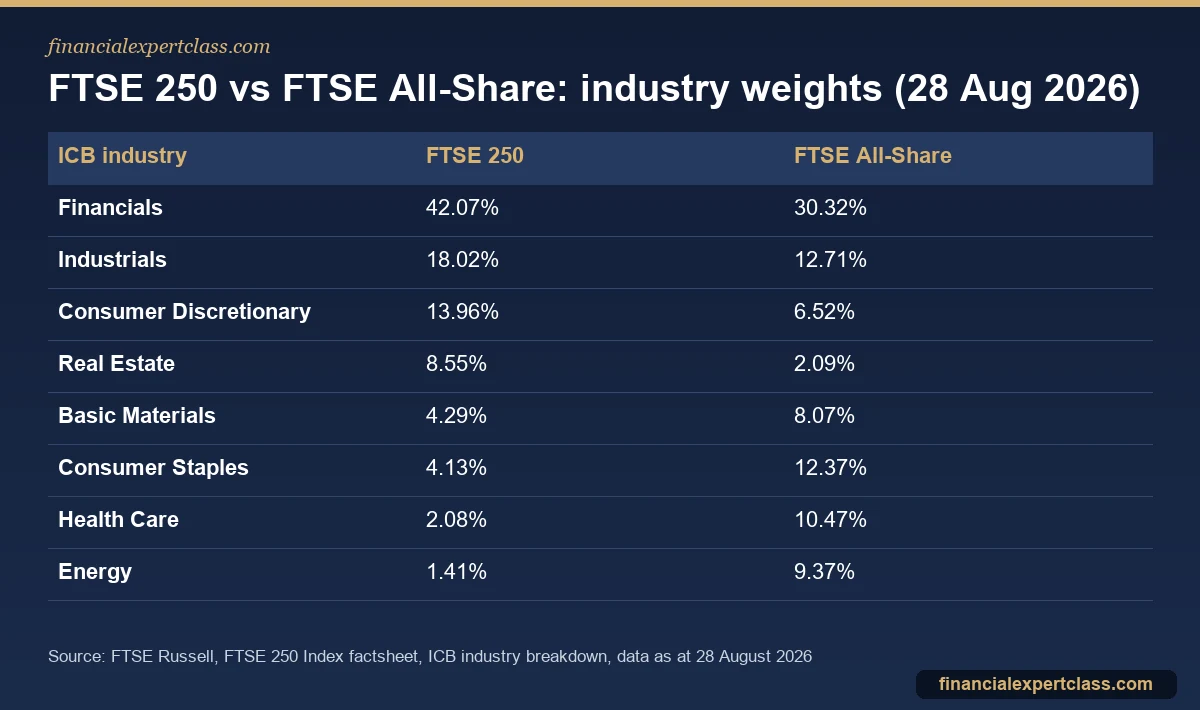
Financials were 42.07% of the index across 113 companies. In particular, that figure includes investment trusts, asset managers, insurers and banks. Industrials (18.02%) are much bigger than in the All-Share. So are consumer discretionary businesses such as travel, housebuilding and retail (13.96%). In addition, real estate is 8.55%. By contrast, the big global oil, pharmaceutical, mining and consumer staples companies that lead the large-cap index barely appear. For example, energy is 1.41% and health care 2.08%.
More domestic exposure
Because of that mix, many see the mid-cap index as a better gauge of the UK economy. Multinational groups in sectors such as energy, health care and mining dominate the large-cap index. In contrast, mid-caps such as housebuilders, retailers, support services and UK-focused lenders tend to depend more on British consumers and businesses. Of course, that cuts both ways. The mid-caps tend to do better when the domestic outlook improves, but worse when UK-specific worries dominate.
Performance and risk
FTSE Russell publishes total-return figures (dividends reinvested) in GBP. As at 28 August 2026:
- FTSE 250: 12 months +13.1%; 3 years 11.6% a year; 5 years 4.1% a year.
- FTSE 100: 12 months +22.8%; 3 years 16.3% a year; 5 years 13.2% a year.
The mid-caps have also been the bumpier ride over that period. Five-year volatility was 15.2%, against 10.2% for the large caps. Also, the worst peak-to-trough drawdown over 10 years was -41.7%, against -34.2%. Calendar-year returns include -13.3% in 2018, +28.9% in 2019, -17.4% in 2022 and +13.0% in 2025.
Past performance is not a guide to future returns, and different periods tell different stories. For instance, in 2017 and 2019 the mid-caps were well ahead. The point is that the two indices behave differently, which is exactly why some investors hold both. Our comparison of the FTSE 100 and Euro Stoxx 50 covers the large-cap side in a European context.
ETFs that track the FTSE 250
You cannot buy an index directly. However, several UCITS ETFs track it, and they trade on the London Stock Exchange in pounds.

- Vanguard FTSE 250 UCITS ETF, distributing (VMID): ongoing charge 0.10%, launched 30 September 2014. It pays dividends quarterly and is domiciled in Ireland. The fund had £2,226 million in total assets across share classes at 31 August 2026. It aims to hold all index constituents, and it uses sampling only where full replication is not practicable.
- Vanguard’s accumulating line (VMIG): the same fund with income reinvested, launched 14 May 2019. It also charges 0.10%.
- iShares’ version (MIDD): the older product, launched 26 March 2004, with a total expense ratio of 0.40%. It uses an optimised (sampling) approach and held 236 securities on 22 September 2026. Its net assets were £650.8 million on 23 September 2026.
On cost alone, the Vanguard lines are cheaper. All three are ISA-eligible and trade in GBP, so a UK investor on a GBP account avoids FX fees. Buying an ETF also avoids the 0.5% stamp duty reserve tax that applies when you buy UK shares directly. Indeed, Trading 212’s fee guide notes there is no stamp duty charge on ETFs. For platform costs, see our breakdown of Trading 212 fees for ETF investors.
Should mid-caps be in your portfolio?
For most long-term investors, the core should be a global index fund. That holds UK companies in proportion to their global size. See our guide to the best global ETFs for UK investors. The mid-cap index can then work as a deliberate satellite if you want:
- a tilt towards smaller, more domestic UK companies;
- diversification away from the handful of mega-caps that dominate global indices;
- quarterly income, given its dividend yield of 3.05% at the end of August 2026.
Keep the position size modest and remember the higher volatility. Also, hold it inside an ISA or SIPP if you can, so dividends and gains are sheltered from tax. Our ISA, LISA and SIPP guide explains the options.
Frequently asked questions
What is the FTSE 250 index?
It is the FTSE Russell index of the 250 mid-sized companies on the London Stock Exchange that rank below the FTSE 100 and pass size and liquidity screens. It launched on 12 October 1992. FTSE Russell weights it by free-float market cap and reviews it quarterly.
Is it better to invest in the FTSE 100 or the FTSE 250?
Neither is better in every period. Large multinational companies dominate the large-cap index, with much bigger weights in energy, health care, basic materials and consumer staples. The mid-cap index, however, is more domestic and more exposed to financials, industrials and consumer businesses. It has also been more volatile. So many investors hold a global fund as their core and use either as a smaller UK tilt.
What is the cheapest FTSE 250 ETF?
Among the main London-listed options, Vanguard’s ETF (VMID distributing, VMIG accumulating) had an ongoing charge of 0.10% as at its 31 August 2026 factsheet. In contrast, the iShares fund (MIDD) had a 0.40% total expense ratio.
How many companies are in the FTSE 250?
There are 250, as the name suggests. However, the membership changes at quarterly reviews, as companies join or leave the large-cap index and move to or from the FTSE SmallCap. Also, ETFs using sampling may hold slightly fewer; iShares MIDD held 236 securities in September 2026.
Cited sources: FTSE Russell: FTSE 250 Index factsheet, FTSE Russell: UK indices, Vanguard FTSE 250 UCITS ETF (VMID) factsheet, Vanguard FTSE 250 UCITS ETF (VMIG) factsheet, iShares FTSE 250 UCITS ETF (MIDD), and Trading 212 Help Centre: stamp duty on ETFs. Verify current fund figures before investing. Educational content, not financial advice.
Not personalised financial advice. Verify your situation with a qualified adviser. Operated by Aurum Digital Marketing LTD (UK), Companies House 15203665.
European UCITS/ETF investor with 11+ years building a global dividend and index portfolio, and founder of Financial Expert Class. I write every guide here from first-hand experience investing across EU brokers and tax regimes — not theory. More about me →