
ISAC vs IWDA: Accumulating World ETF Comparison
Plug both tickers into the ETF drawdown comparator for the risk-side numbers.
For wider context on how ISAC and IWDA fit alongside FTSE All-World, see our VWCE vs FTSE All-World comparison hub. Additionally, that guide covers other one-fund global equity options. New to accumulating UCITS ETFs? Start with the European ETF investing beginner roadmap 2026.
ACWI (ISAC) versus MSCI World (IWDA) is one decision: whether you want emerging markets. ISAC holds them at 11.78% of the index; IWDA holds none. Both charge 0.20%, both are Irish, accumulating and physically replicated, and the US weight is the tell — 61.35% in ISAC against 69.07% in IWDA. ISAC is EUR 30,763m, IWDA EUR 126,744m, both at 31 July 2026 (IE00B6R52259, IE00B4L5Y983). If you want one fund and no rebalancing, ISAC. If you want the cheapest ACWI, neither — see the 0.12% alternative below.
Both funds are available at every mainstream EU broker. The two I use and would point a European investor to first:
EU-regulated (CySEC) · 1,500+ UCITS ETFs · from €0 commission plansInteractive Brokers
Lowest FX & commission costs · every EU exchange · best for larger portfolios
Affiliate links — if you open an account I may earn a commission at no cost to you. It never changes which fund I recommend. Compare all EU brokers →
Both ISAC and IWDA deliver best-in-class global equity exposure, and they sit in iShares’ accumulating lineup at an identical 0.20%. Beneath that identical fee lies the divergence: ISAC covers developed and emerging markets worldwide, while IWDA restricts you to developed nations only. For European investors building globally diversified portfolios, that is the distinction that matters.
Comparing these funds? Take the decision workbook with you.
The ETF Comparison Workbook: TER, domicile, withholding and overlap checks in one printable spreadsheet.
Comparing funds is step one — the Masterclass turns it into a complete plan — fund choice, broker setup, YOUR country’s taxes and the first purchase, in 55 text lessons.
The ISAC vs IWDA choice fundamentally shapes your global equity allocation. Both funds track different MSCI indices at identical costs. Yet they deliver meaningfully different returns and risk profiles. ISAC’s all-world approach returned 10.08% over the past year. By contrast, IWDA returned 8.33%. Therefore, emerging market exposure translates to a measurable performance difference. This comprehensive comparison reveals which accumulating world ETF fits your investment philosophy. Additionally, it shows which ETF suits your portfolio construction goals.
Understanding the Index Difference
ISAC tracks the MSCI All Country World Index (ACWI). It covers large and mid-cap stocks from 47 countries. Specifically, this means 23 developed and 24 emerging markets. IWDA, by contrast, tracks the MSCI World Index. That index covers only 23 developed countries. Crucially, this core distinction shapes everything. It drives geographic exposure, sector allocation, volatility, and long-term return potential. However, neither approach proves universally superior. Instead, they reflect different philosophies about global equity investing.
Methodology: every shortlist on this page applies our ETF selection methodology.
Use the long-term return projector to see the doubling-time math for your assumed return.
The MSCI World Index, tracked by IWDA, held 1,282 constituents at 31 July 2026 — large and mid caps in developed economies, not the “roughly 1,500 large-cap companies” this paragraph used to claim (MSCI World index data). It is the gold standard for developed-market-only exposure, with proven stability and liquidity. By contrast the MSCI ACWI tracked by ISAC held 2,460 constituents at the same date (MSCI ACWI index data), adding exposure to emerging giants like China, India and Brazil. For 21st-century global investors, this emerging market inclusion matters. Crucially, it delivers diversification gains that developed-market-only funds sacrifice.
ISAC: The All-World Gateway to Emerging Markets
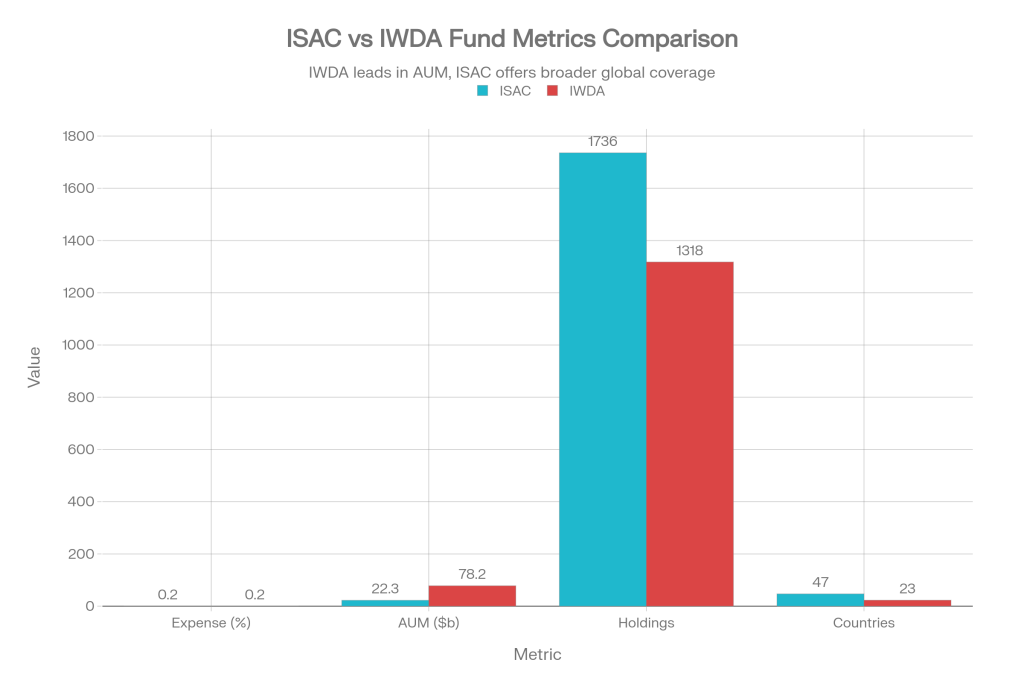
ISAC (iShares MSCI ACWI UCITS ETF USD Accumulating) provides comprehensive global exposure. Notably, it covers all economic development stages. ISAC held EUR 30,763m at 31 July 2026 across 1,682 holdings (justETF profile, IE00B6R52259) — this page previously said $22.3 billion and 1,736 holdings, both years out of date. It delivers broad diversification across 47 countries, and the accumulating structure reinvests dividends automatically, which matters for long-term compounding. For investors wanting emerging-market exposure inside a single vehicle, ISAC removes the need for a separate EIMI position.
Correction, and it is the one that matters most on this page: ISAC’s United States weight is 61.35%, not the 68.89% previously shown here. The 68.89% figure is close to IWDA’s US weight (69.07%), which is what it appears to have been — the developed-world number pasted into the all-world fund, erasing the very difference this comparison exists to explain. From justETF at 30 July 2026, ISAC is United States 61.35%, Japan 5.02%, United Kingdom 3.31%, Canada 3.04%, against IWDA at United States 69.07%. Emerging markets are 11.78% of MSCI ACWI, not “roughly 10%”. Individual emerging-country weights are not published on the public profile, so the China and India figures this paragraph used to carry have been removed rather than refreshed. This structure avoids overweighting the wealthiest nations and is why ISAC’s one-fund approach simplifies portfolio construction.
IWDA: Developed Markets Expertise and Scale
IWDA (iShares Core MSCI World UCITS ETF USD Accumulating) represents the world’s largest single-ETF exposure to developed markets. It held EUR 126,744m at 31 July 2026 — not the $78.2 billion this page used to show — which is about 4.1 times ISAC’s size (justETF profile, IE00B4L5Y983). Consequently, IWDA offers unmatched liquidity and execution efficiency, trading on the LSE, Euronext and Xetra, and delivers the tightest bid-ask spreads available for global developed-market exposure. One practical note the page never made: on Xetra the tickers are EUNL for IWDA and IUSQ for ISAC, so searching “IWDA” on a German venue finds nothing.
IWDA’s developed-market-only approach appeals to investors sceptical of emerging markets’ regulatory frameworks, or wary of the currency and geopolitical risk. The fund holds 1,281 positions across 23 wealthy nations, where institutional protections, corporate governance and accounting standards exceed emerging-economy safeguards. Developed markets have offered lower volatility: IWDA’s one-year volatility is 10.66% in EUR, against 10.35% for ISAC at 31 July 2026 — not the 15.45% this page carried, which was a figure from a more turbulent period and is now stale in a way that flatters the risk case. Furthermore, the fund provides predictable dividend streams. For risk-averse investors prioritising capital preservation over emerging market upside, IWDA’s focused approach delivers peace of mind.
Performance Analysis: Emerging Market Returns
Recent performance shows how emerging markets contribute to total returns. Over the past 12 months, ISAC delivered 10.08% returns. By contrast, IWDA achieved 8.33%. Therefore, ISAC enjoyed a 1.75% performance advantage. This gap stems directly from emerging market exposure. The spread appears modest. However, it compounds dramatically over decades. This page used to project that gap out: “a €100,000 investment growing at these differential rates produces €174,000 in extra wealth over 30 years”. Both the arithmetic and the reasoning were wrong. Compounding €100,000 at 10.08% versus 8.33% for thirty years gives roughly €1.78m against €1.10m — a gap near €680,000, not €174,000. More importantly, extrapolating a single twelve-month return difference over three decades is not a valid inference: the same exercise run in 2015 would have projected the opposite result, because the page’s own five-year and three-year figures show IWDA ahead. The projection has been withdrawn rather than corrected. Emerging-market exposure is a diversification decision, not a forecast.
Longer time horizons reveal more nuanced performance relationships. Over five years, IWDA returned 88.05%. By contrast, ISAC returned 80.02%. Therefore, developed markets captured disproportionate gains during this period. Over three years, IWDA again led with 61.23% returns. ISAC, meanwhile, posted 59.23%. This historical pattern reflects cyclical economic dynamics. For example, periods of dollar strength and technology dominance favoured IWDA. By contrast, emerging market rallies would likely reverse this performance advantage. Crucially, neither fund shows consistent superiority. Instead, they operate across different economic cycles.

Expense Ratio and Cost Comparison
Both ISAC and IWDA charge identical 0.20% total expense ratios, so cost does not differentiate these two funds. It does differentiate ISAC from the rest of the ACWI shelf, which this page never mentioned: the State Street SPDR MSCI ACWI UCITS ETF (IE00B44Z5B48) tracks the identical index for 0.12% and holds EUR 15,758m (justETF profile). That is 8 basis points a year, €80 on €100,000, for the same exposure — a bigger saving than most of the differences argued over on this page. Over 30-year investment horizons, this 0.20% annual drag reduces final wealth by roughly 5.5% relative to index-matching returns. However, both funds incur identical costs. Consequently, your performance differences stem entirely from index methodology and market cycle dynamics. Management fees do not drive the gap.
Trading costs deserve equal consideration alongside listed expense ratios. IWDA’s much larger $78.2 billion asset base generates tighter bid-ask spreads. Typically, these run 0.01-0.02% for standard position sizes. ISAC’s smaller $22.3 billion AUM produces slightly wider spreads of 0.03-0.05%. Consequently, large purchases pay an extra 0.02-0.03% in trading costs. For investors deploying €10,000+ regularly, these spread differences add up. In fact, they reach hundreds of euros annually. By contrast, monthly €500 investments see negligible spread differences. Furthermore, the discipline benefits of systematic purchasing outweigh those small costs.
Geographic Diversification Advantage
ISAC’s inclusion of 24 emerging markets defines its key advantage. Notably, emerging market exposure provides genuine portfolio diversification benefits. These include low correlation with developed markets during crises. Additionally, you gain currency diversification and exposure to higher-growth economies with expanding middle classes. For example, China’s 2.86% weight in ISAC gives direct exposure to the world’s second-largest economy. Furthermore, China sits at the heart of technology innovation. By contrast, this exposure is completely absent from IWDA.
The geographic difference becomes critical during specific market cycles. Between 2000-2010, emerging markets dramatically outperformed developed economies. Consequently, this created wealth dispersion for IWDA investors who lacked emerging market exposure. By contrast, 2010-2020 saw developed market dominance, particularly in US tech. Therefore, IWDA holders benefited during that decade. Modern portfolio theory supports broadly distributed geographic exposure. Specifically, it reduces concentration risk and smooths returns across market cycles. ISAC’s all-world approach achieves this ideal. However, IWDA’s developed-only focus concentrates risk on wealthy nations.
Sector Allocation Analysis
Despite tracking different indices and regions, ISAC and IWDA maintain remarkably similar sector allocations. Technology dominates both, and by more than this page used to say: on justETF’s classification at 30 July 2026, Technology is 34.88% of IWDA and 35.57% of ISAC, with Finance 18.47% and 18.94% and Healthcare 9.00% for IWDA. The old figures — 28% technology, 14-15% financials, 11-12% healthcare — understate the technology concentration by around seven points, which is the single most important risk fact about either fund. Note that sector schemes differ (justETF groups differently from GICS), so compare like with like before quoting a number. The sector similarity stems from one source. Specifically, technology companies dominate in both developed and emerging markets. For example, NVIDIA, Apple, Microsoft, and Amazon hold substantial positions in both ISAC and IWDA. Consequently, you get comparable technology exposure regardless of fund choice.
The sector convergence reveals an important truth. Notably, global mega-cap equity markets are increasingly homogeneous. Whether you pick ISAC or IWDA, you mainly invest in large US technology companies with multinational operations. Therefore, the difference lies in diversification breadth, not in core holdings. Both funds concentrate 24-28% of portfolios in technology. Consequently, they create similar systematic technology risk exposure.
Volatility and Risk Assessment
ISAC and IWDA display nearly identical risk characteristics. One-year volatility shows only marginal differences. One-year volatility is 10.66% for IWDA and 10.35% for ISAC in EUR at 31 July 2026. Maximum drawdowns since inception are close: IWDA -33.91%, ISAC -33.59%. What this page used to say next was impossible: neither fund experienced the 2008 financial crisis, because neither existed. IWDA launched on 25 September 2009 and ISAC on 21 October 2011. The drawdowns above are from the 2020 and 2022 episodes, not 2008, and any reasoning that leans on 2008 behaviour is reasoning about the index, not the fund. Sharpe ratios are essentially equivalent. IWDA shows 1.14, with ISAC at 1.16. Consequently, both funds deliver comparable returns per unit of risk assumed.
The minimal volatility difference reflects a fundamental market reality. Specifically, emerging markets exhibit similar drawdown behaviour to developed markets during systemic crises. They may grow faster, but they fall together. For example, when equity markets crashed 33-40% in 2008, both developed and emerging economies contracted severely. By contrast, during recovery periods, emerging markets often lead returns. However, they also bring commensurate volatility. Importantly, neither fund proves materially safer than the alternative. Instead, they deliver comparable risk-adjusted returns through different geographic compositions.
Fund Size and Liquidity Impact
IWDA’s massive $78.2 billion asset base provides unparalleled liquidity. Trading volume tops 381,000 shares daily on average. Therefore, you can execute multi-million-euro positions with minimal market impact. For institutional investors, pension funds, and those making substantial portfolio adjustments, IWDA’s scale eliminates liquidity concerns. Consequently, you never question whether you can exit or add positions at fair valuations.
ISAC’s $22.3 billion AUM remains respectable. Furthermore, it provides sufficient liquidity for most European retail investors. Daily trading volumes typically top 100,000 shares. Therefore, standard position sizes execute acceptably. However, investors deploying €500,000+ positions may meet slightly wider spreads. In some cases, they may need split execution. By contrast, systematic investors making regular €1,000-5,000 monthly purchases find ISAC’s liquidity entirely adequate. Fund size matters mainly for large, infrequent transactions. Specifically, those needing immediate execution at precise valuations care most about scale.
Which Fund Suits Your Investment Profile?
✓ Choose ISAC If:
- You want all-world exposure in one fund
- You believe emerging markets offer long-term growth
- You prefer geographic diversification beyond wealthy nations
- You want to avoid separate emerging markets ETF
- You’re comfortable with slightly higher volatility for growth potential
- You seek simplified portfolio structure
✗ Consider IWDA If:
- You prefer developed-markets-only exposure
- You want maximum liquidity and tightest spreads
- You’re making very large trades (€500,000+)
- You want the largest, most established global ETF
- You believe in developed-market stability premium
- You’re supplementing with separate emerging markets ETF
Portfolio Construction Strategies
Strategy 1: All-World Single ETF – Buy ISAC as your entire equity allocation. This approach maximises geographic diversification. Additionally, it eliminates decisions about emerging market weighting. Consequently, it simplifies portfolio maintenance. Notably, it suits buy-and-hold investors seeking simplicity.
Strategy 2: Developed Markets Focus – Pick IWDA as your core global holding. Then supplement with a dedicated emerging markets ETF (EIMI) at your preferred weighting. For example, a common split is 80% IWDA / 20% EIMI. This approach gives precise control over emerging market exposure. Therefore, it suits investors skeptical of emerging economies.
Strategy 3: Geographic Hedge – Use ISAC for your primary global allocation. However, layer currency hedging if you want to protect against USD weakness versus your home currency (EUR). Consequently, this maintains all-world exposure while managing currency risk explicitly.
Our hedged-ETF cost tool estimates the annual drag of an FX hedge on UCITS holdings.
Historical Performance Insights
Annual returns reveal market cycle dynamics. In 2024, IWDA delivered 26.24% returns. By contrast, ISAC achieved 24.82%. Therefore, developed markets outperformed that year. In 2023, IWDA gained 19.55%. ISAC, meanwhile, posted 18.11%. Yet in 2022’s bear market, both experienced similar losses. Specifically, IWDA fell 12.96% and ISAC dropped 13.12%. Consequently, their risk profiles converge during crises. This historical pattern suggests market cycles favour different approaches. IWDA leads during developed-market rallies. By contrast, ISAC takes the lead during emerging market strength.
Long-term data shows IWDA’s 10.97% annualised return over 10 years marginally beats ISAC’s 10.25%. However, this period from 2015-2025 covers exceptional US and developed-market technology dominance. By contrast, earlier periods such as 2001-2011 would likely show ISAC outperformance due to emerging market strength. Investors should avoid assuming historical outperformance continues indefinitely. Crucially, market cycles shift which fund leads performance.
Tax Efficiency Comparison
Both ISAC and IWDA use accumulating structures that reinvest dividends automatically. This tax-efficient approach suits European investors in accumulation phases. Specifically, it avoids taxable dividend distributions. Dividend yields on both funds run roughly 1.5-1.8% annually. Therefore, this creates modest income that compounds within the ETF. For EU investors, UCITS compliance ensures favourable dividend withholding tax treatment. Typically, this means 15% under treaty arrangements.
Half of this is now wrong and the correction opens an option the page closed off. MSCI World does have a distributing class: the iShares Core MSCI World UCITS ETF USD (Dist), IE000OHHIBC6, ticker IWDD — 0.20%, EUR 802m, quarterly distributions, launched 26 July 2023. For MSCI ACWI the claim holds: justETF lists no distributing ACWI UCITS ETF, so an income investor who wants all-world exposure genuinely does have to build it. Consequently, income-focused investors are not shut out of the developed-world side at all. If you need regular distributions, consider separate IWDA+EIMI combinations with distributing classes. Those may better match your cash flow needs. For most European accumulators, the automatic reinvestment benefits prove superior. Furthermore, simplified tax reporting also helps.
The Emerging Markets Question
The fundamental decision between ISAC and IWDA boils down to one question. Should your global equity portfolio include emerging market exposure? Emerging markets offer higher long-term growth potential. However, they also bring greater volatility, regulatory uncertainty, and currency fluctuation. By contrast, developed markets provide stability, mature corporate governance, and proven track records. Modern portfolio theory suggests diversification benefits justify emerging market inclusion. Notably, correlations between developed and emerging markets stay below 1.0. Therefore, they provide genuine diversification benefits.
Academic research supports this view. Specifically, studies show that global portfolios including 20-30% emerging market exposure deliver superior risk-adjusted returns. By contrast, developed-markets-only allocations underperform. ISAC provides roughly 10% emerging market exposure naturally within its index methodology. If you wanted to build a comparable allocation using IWDA, you would need roughly 88% IWDA + 12% EIMI, matching MSCI ACWI’s 11.78% emerging weight (EIMI, IE00BKM4GZ66, 0.18%, EUR 37,658m). One caveat worth knowing: EIMI tracks MSCI EM IMI, which adds small caps, while ACWI’s emerging sleeve is large and mid cap only — so the blend approximates ISAC rather than replicating it. Consequently, ISAC’s simplified structure achieves this optimal allocation in a single vehicle.
Practical Implementation Considerations
For Dollar-Cost Averaging: Both funds suit monthly investing perfectly. ISAC’s slightly wider spreads prove negligible for €500 monthly purchases. Over 30 years, spread differences on small monthly purchases add up to tens of euros. Consequently, they remain immaterial compared to the discipline benefits of systematic investing.
For Lump-Sum Investments: IWDA’s superior liquidity becomes more relevant. For example, if you deploy €100,000+ immediately, IWDA’s tighter spreads deliver meaningful execution advantages. However, ISAC’s spreads still remain acceptable for single transactions.
For Portfolio Rebalancing: If you need quarterly or annual rebalancing, IWDA’s efficiency advantages emerge. Specifically, regular large trades accumulate spread costs. By contrast, IWDA’s liquidity minimises these expenses. ISAC remains practical for rebalancing. However, it requires patience during larger adjustments.
Looking Forward: Which Funds Dominate Future Returns?
Predicting which fund outperforms proves impossible. If emerging markets experience a renaissance, ISAC outperforms. Notably, this scenario looks plausible given demographic trends, infrastructure development, and middle-class expansion. By contrast, if developed economies keep technology dominance and demographic advantages, IWDA leads. Rather than attempting market timing, professional investors typically hold both. Alternatively, they use ISAC’s balanced all-world approach. Emerging markets’ long-term structural advantages suggest ISAC’s all-world inclusion positions investors well. Consequently, ISAC sets up 21st-century wealth creation better than IWDA’s developed-market concentration.
The Final Verdict
Conclusion
ISAC and IWDA represent two philosophically distinct approaches to global equity investing. ISAC provides all-world exposure including emerging markets in a single vehicle. Notably, it does so at a 0.20% expense ratio. Furthermore, 10.08% one-year returns demonstrate emerging market strength. By contrast, IWDA offers developed-markets-only exposure with unmatched liquidity. Specifically, it holds $78.2 billion in assets and proven stability. However, neither fund proves universally superior. Your choice depends on whether you embrace emerging market diversification. Alternatively, you may prefer developed-economy focus.
For most European accumulating investors, ISAC delivers superior portfolio construction simplicity. Specifically, you get one fund, maximum geographic diversification, identical costs to IWDA, and simplified portfolio maintenance. Additionally, the emerging market exposure provides genuine diversification benefits. These benefits include low correlations, currency diversity, and exposure to future economic powerhouses. Notably, ISAC’s 10.08% annual returns show these advantages in real time.
Choose IWDA if you make very large institutional trades, prefer developed-market-only exposure, or want to actively manage emerging market weighting separately. IWDA’s $78.2 billion scale provides unparalleled liquidity and execution efficiency for large positions. Furthermore, those supplementing IWDA with dedicated emerging markets exposure (EIMI) benefit. Consequently, this split approach offers maximum flexibility and control.
Both funds use identical 0.20% expense ratios. Additionally, they distribute through accumulating structures and maintain UCITS compliance. Therefore, your selection comes down to geographic philosophy. Specifically, you pick one world (ISAC) or developed markets plus optional emerging market overlay (IWDA). The optimal decision aligns with your conviction about emerging markets’ long-term importance. Crucially, only you can answer that question definitively for your portfolio.
Tracking Difference and Securities Lending: Where the Real Cost Hides
Both ISAC and IWDA carry the same 0.20% headline TER. However, the metric serious European investors should watch is tracking difference. Specifically, this is the actual annual gap between NAV return and the underlying MSCI index. Tracking difference includes the TER and securities-lending revenue, which offsets cost. Additionally, it covers withholding-tax leakage on US dividends. Furthermore, it captures the rebalancing cost of holding 1,300+ vs 2,300+ names. In practice, both funds have tended to track within roughly 0.15-0.25% of their reference index on a rolling 1-year basis. Notably, IWDA tends to track slightly tighter. This stems from its MSCI World universe being smaller and easier to replicate. Live tracking-difference tables are published by justETF and Morningstar UK. Furthermore, both iShares funds disclose their securities-lending revenue split in the annual report on the iShares UK product pages.
Withholding Tax on US Dividends (the L1 layer)
Both funds are Irish-domiciled UCITS. Consequently, they benefit from the US-Ireland tax treaty. Specifically, it applies a 15% withholding rate on US dividends instead of the 30% statutory rate. The US makes up 69.07% of IWDA and 61.35% of ISAC — a range this page previously gave as “roughly 65-69% of both”, which is right for IWDA only. Therefore, this treaty rate represents one of the largest invisible cost components of any global equity ETF held by a European investor. The Irish UCITS wrapper explains why European retail investors strongly prefer IE-domiciled products over US-listed equivalents. Importantly, this structural advantage is confirmed in the UCITS framework supervised by ESMA.
German Teilfreistellung and Long-Term Tax Drag
For German tax residents, both ISAC and IWDA qualify as equity funds under InvStG 2018. Specifically, they hold more than 51% in listed equities. Consequently, 30% of capital gains and accumulated income receive a Teilfreistellung (partial exemption). This exemption applies before the 25% Abgeltungsteuer hits. Therefore, the effective headline tax rate on equity ETF gains drops. The same regime applies to the annual Vorabpauschale advance levy that accumulating funds attract. German oversight of UCITS distribution sits with BaFin. Meanwhile, EU-level UCITS rules are coordinated by ESMA. Investors in Cyprus, Malta or other EU jurisdictions should check their local tax treatment. In many cases, accumulating share classes defer realised gains until disposal. Consequently, this can compound favourably over 20-30 years. However, this is general information, not personal tax advice.
Frequently Asked Questions
ACWI vs IWDA: what is the actual difference?
One thing: emerging markets. MSCI ACWI carries them at 11.78% of the index and MSCI World carries none, which shows up as a US weight of 61.35% in ISAC against 69.07% in IWDA. ACWI held 2,460 constituents at 31 July 2026 against MSCI World’s 1,282. Both funds charge 0.20%, are Irish-domiciled, accumulating and physically replicated by optimised sampling, so nothing else about them differs in a way you would notice. If you want one fund and no rebalancing, that is ISAC; if you want developed-only, IWDA plus EIMI at roughly 88/12 gets you back to the same place with an extra line to manage.
Is IWDA accumulating or distributing?
IWDA (IE00B4L5Y983) is accumulating — dividends are reinvested inside the fund and never reach your account. Since 26 July 2023 there has also been a distributing class of the same fund: IWDD, IE000OHHIBC6, same 0.20% TER, EUR 802m, paying quarterly. For MSCI ACWI there is no distributing UCITS equivalent, so ISAC accumulates and there is no alternative.
What is the cheapest MSCI ACWI ETF?
Not ISAC. The State Street SPDR MSCI ACWI UCITS ETF (IE00B44Z5B48) tracks the same index for 0.12% and held EUR 15,758m at 31 July 2026, against ISAC’s 0.20% and EUR 30,763m. Eight basis points is €80 a year on €100,000 — more than most of the differences argued over between ACWI and World. ISAC’s advantage is scale and listing depth, not price.
What is the ISIN difference between ISAC and IWDA?
ISAC trades under ISIN IE00B6R52259 (iShares MSCI ACWI UCITS ETF USD Accumulating). IWDA trades under ISIN IE00B4L5Y983 (iShares Core MSCI World UCITS ETF USD Accumulating). Both are Irish-domiciled UCITS funds. Furthermore, both use physical replication via optimised sampling. Always confirm the ISIN on the official KID before placing an order. Notably, tickers can vary between Xetra, LSE and Euronext listings.
Is ISAC or IWDA better for a long-term buy-and-hold European investor?
For a true one-fund global equity sleeve, ISAC is the simpler choice. Specifically, it already includes around 10% emerging markets exposure. By contrast, IWDA is the developed-only building block typically paired with EIMI at roughly 88/12 to recreate the same global weights. Both have identical 0.20% TER. Therefore, the decision is structural rather than cost-driven. Pick ISAC for simplicity. Alternatively, pick IWDA + EIMI for explicit control over the EM weight.
How does ISAC compare with VWCE (Vanguard FTSE All-World)?
ISAC tracks MSCI ACWI, which holds around 2,350 large- and mid-cap names across 47 countries. By contrast, VWCE tracks FTSE All-World, which holds around 3,700 names. Specifically, FTSE includes South Korea in its developed bucket and reaches a bit deeper into mid-caps. VWCE charges 0.14% TER vs ISAC’s 0.20%. Both are accumulating Irish UCITS. Notably, we compare them in detail in our VWCE vs FTSE All-World comparison hub.
Are ISAC and IWDA currency-hedged to EUR?
No. Both funds are USD-denominated. Consequently, they translate the underlying global equity returns into your home currency at the prevailing FX rate. For most long-horizon European investors, an unhedged global equity ETF is the standard recommendation. Specifically, FX moves tend to wash out over 20-30 years, and hedging costs compound. However, if you specifically need EUR-hedged developed-world exposure, the iShares MSCI World EUR Hedged UCITS ETF (IBCH) is the closest sibling.
How wide are bid-ask spreads on Xetra for ISAC vs IWDA?
During Xetra core hours (09:00-17:30 CET), IWDA typically trades at 1-3 basis points spread. Specifically, this stems from its very large AUM and high daily volume. By contrast, ISAC spreads sit in the 3-5 basis point range for retail-size orders. For monthly DCA of a few hundred euros, the difference is immaterial. However, for lump sums above 100,000 EUR, the spread gap is worth modelling. Importantly, limit orders rather than market orders are recommended for any UCITS ETF trade.
Can I hold both ISAC and IWDA in the same portfolio?
It is not recommended. Notably, the two funds overlap heavily on developed-market large-caps. Therefore, holding both produces roughly 90% duplication. Furthermore, it only marginally increases EM exposure. If you already own IWDA and want EM exposure, adding EIMI is the cleaner choice. By contrast, if you want one global fund, replace the IWDA position with ISAC. For portfolio composition guidance, see our balanced ETF portfolio guide.
Where can I read the official MSCI ACWI and MSCI World index methodology?
MSCI publishes the full methodology documents on msci.com. Specifically, MSCI World covers 23 developed markets and around 1,500 names. By contrast, MSCI ACWI adds 24 emerging markets for a total of around 2,350 names. Both indices are free-float-market-capitalisation weighted with quarterly rebalances. Furthermore, independent factsheets, tracking-difference tables and historical NAV data for ISAC and IWDA are published by justETF and Morningstar.
Sources and further reading
- justETF — European UCITS ETF screener
- Morningstar UK ETF rankings
- ESMA — European Securities and Markets Authority
- Bogleheads wiki — EU investing
- ETF.com industry data
European UCITS/ETF investor with 11+ years building a global dividend and index portfolio, and founder of Financial Expert Class. I write every guide here from first-hand experience investing across EU brokers and tax regimes — not theory. More about me →