
Emerging Markets ETF Comparison: VWCE vs EMIM vs IEMA
To put together a complete UCITS allocation in one screen, the portfolio construction tool walks you through it.
For the wider context on how VWCE compares with FTSE All-World peers and accumulating world ETFs, see our VWCE vs FTSE All-World comparison hub. Additionally, for fund-house level differences between iShares (EMIM, IEMA) and Vanguard (VWCE), review our European ETF providers compared 2026 overview.
Comparing funds is step one — the Masterclass turns it into a complete plan — fund choice, broker setup, YOUR country’s taxes and the first purchase, in 55 text lessons.
Emerging markets present compelling opportunities for diversification. However, selecting the right ETF requires careful analysis. VWCE, EMIM, and IEMA represent three distinct approaches to capturing global growth. VWCE offers worldwide exposure with emerging market inclusion. By contrast, EMIM provides comprehensive emerging market coverage across all company sizes. IEMA focuses on large and mid-cap emerging market firms. Understanding these differences proves essential for informed investment decisions. For more detail, see our guide: VT ETF in the UK and EU.
Understanding the Fundamental Differences
Index Structure and Composition
VWCE tracks the FTSE All-World index. It encompasses approximately 3,600 stocks across developed and emerging markets. This Vanguard fund uses physical replication with optimization techniques. Moreover, the portfolio balances developed market stability with emerging market growth potential. Geographic allocation leans heavily toward developed economies, particularly the United States at 63%.
Selection criteria: the ETF selection methodology explains exactly how funds earn a place in this comparison.
EMIM follows the MSCI Emerging Markets IMI index. It captures large, mid, and small-cap companies exclusively in emerging economies. BlackRock manages this fund with physical replication. The IMI designation signifies “Investable Market Index,” covering approximately 99% of free-float adjusted market capitalization in emerging markets. Notably, holdings total around 3,243 companies, providing extensive diversification within developing economies.
IEMA tracks the standard MSCI Emerging Markets index. It focuses on large and mid-cap stocks from emerging economies. This BlackRock fund contains approximately 1,051 holdings, representing 85% of emerging market capitalization. Crucially, the narrower focus targets established emerging market companies with proven track records. Therefore, this approach reduces exposure to smaller, potentially volatile firms.
Cost Structure Analysis
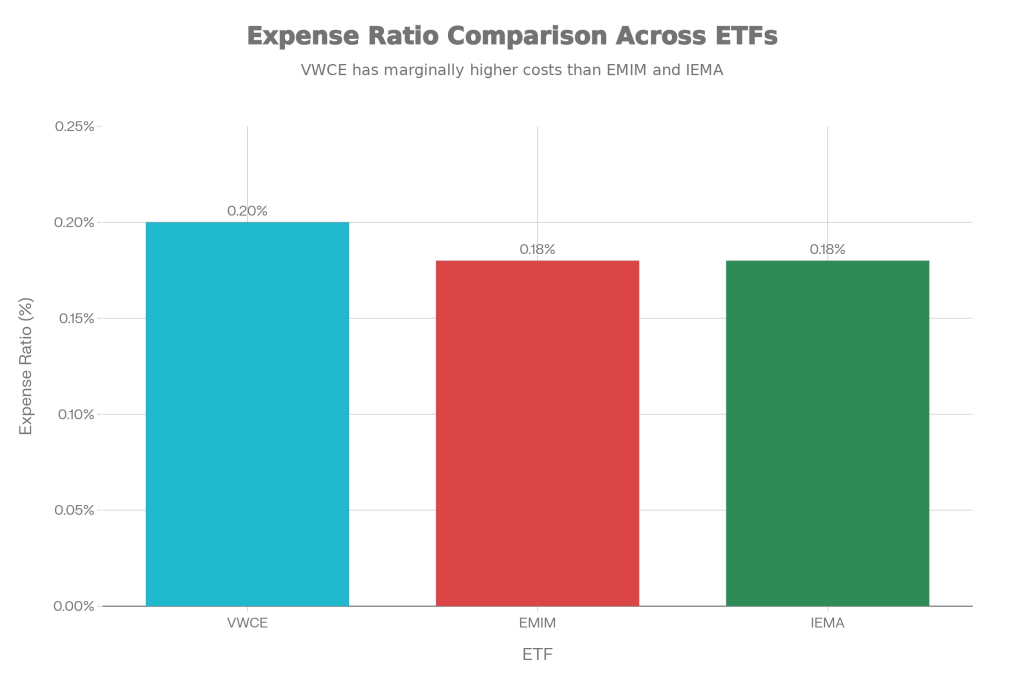
Expense ratios reveal competitive pricing across all three funds. VWCE charges 0.14% annually after Vanguard’s 2025-26 fee cuts. EMIM maintains a 0.18% expense ratio, matching IEMA’s identical fee structure. Consequently, the minimal cost difference between these funds makes expense ratios a secondary consideration. In practice, investors should prioritize strategic fit over marginal cost variations.
Transaction costs deserve attention for active investors. Trading volumes and bid-ask spreads vary by exchange and fund size. Both VWCE and EMIM manage assets exceeding EUR 27 billion, ensuring robust liquidity. IEMA’s EUR 6 billion asset base provides adequate trading depth. Importantly, higher trading volumes typically translate to tighter spreads and lower execution costs.

Geographic Allocation and Market Exposure
VWCE Global Diversification
North American stocks dominate VWCE holdings at 66%. This figure primarily reflects US market capitalization. Asian markets contribute 16% to the portfolio. European equities account for 11% of total assets. Emerging markets represent approximately 10-12% of VWCE’s composition. In short, this allocation mirrors global market capitalization weights, providing natural diversification across economic cycles.
The developed market bias offers stability during turbulent periods. US technology giants anchor the portfolio. For example, NVIDIA sits at 4.76%, Microsoft at 4.19%, and Apple at 3.68%. These holdings provide exposure to innovation and established profitability. Additionally, the emerging market component adds growth potential without excessive concentration risk. Investors seeking balanced global exposure find VWCE’s allocation appropriate.
EMIM and IEMA Emerging Market Concentration
Both EMIM and IEMA allocate 100% to emerging economies. Asian markets dominate at approximately 75%. Taiwan leads country allocations due to Taiwan Semiconductor Manufacturing’s market presence. China follows with significant weightings in technology and consumer sectors. Moreover, India contributes through financial services and technology holdings. By contrast, Latin America and Middle East exposure each represent roughly 10% of portfolios.
Taiwan Semiconductor Manufacturing anchors both funds. It represents 8.73-10.29% in EMIM and 8.81-11.84% in IEMA. Tencent Holdings provides exposure to Chinese internet services at 4.17-4.6% in EMIM and 4.8-5.27% in IEMA. Samsung Electronics offers Korean technology exposure. Additionally, HDFC Bank captures Indian financial sector growth. Notably, this concentration in select names creates both opportunity and risk.
Portfolio Construction and Holdings Depth
Diversification Through Company Size
EMIM distinguishes itself through small-cap inclusion. The fund captures large, mid, and small-cap stocks across emerging markets. Consequently, this comprehensive approach provides exposure to 3,243 companies, including tomorrow’s potential leaders. Small-cap stocks often deliver superior growth rates but carry higher volatility. Therefore, investors with longer time horizons may benefit from this expanded universe.
IEMA focuses exclusively on established companies. The 1,051 holdings emphasize large and mid-cap stocks with proven business models. In practice, this strategy reduces exposure to illiquid small-cap stocks. Financial stability improves through focus on companies with substantial market capitalizations. Conservative investors preferring mature businesses may favor IEMA’s approach.
VWCE balances diversification across market capitalizations. The 3,600 holdings span developed and emerging markets across size segments. Technology sector exposure reaches 27-31% of portfolio weight. Financial services contribute 15.7% to holdings. Moreover, this broad diversification reduces single-stock risk while maintaining growth potential. The approach suits investors seeking comprehensive global exposure through one vehicle.
Performance Characteristics and Returns
Historical Return Analysis
Recent performance shows emerging markets gaining momentum. EMIM delivered returns between 15-21% over the past year. This reflects renewed investor interest in developing economies. IEMA posted 18-19% annual returns, demonstrating similar strength in large and mid-cap emerging stocks. By contrast, VWCE generated 12-13% returns, balancing developed market stability with emerging market growth.
Longer-term results reveal valuation cycles. VWCE achieved approximately 12.5% compound annual growth since its 2019 inception. EMIM and IEMA show 5-year annualized returns around 6.4-7%. These reflect challenging periods for emerging markets from 2019-2024. Notably, the 2025 resurgence in emerging market performance follows years of undervaluation relative to developed markets.
Volatility and Risk Considerations
Emerging market funds exhibit higher volatility than developed market alternatives. Currency fluctuations amplify returns in both directions. Political events can trigger rapid price movements. Furthermore, EMIM and IEMA face concentrated exposure to Asian markets, particularly Taiwan and China. Consequently, geopolitical tensions create additional uncertainty for these holdings.
VWCE mitigates volatility through geographic diversification. The 66% allocation to North American markets provides stability during emerging market corrections. In practice, this structure smooths returns across economic cycles. Investors accepting higher short-term volatility may prefer pure emerging market exposure through EMIM or IEMA. By contrast, risk-averse investors often favor VWCE’s balanced approach.
Dividend Policy and Tax Efficiency
Accumulation Strategy Benefits
All three funds employ accumulating structures. They automatically reinvest dividends without distribution to shareholders. This approach offers several advantages for long-term investors. Importantly, tax efficiency improves as investors avoid immediate taxation on dividend income. Compound growth accelerates through continuous reinvestment. Additionally, administrative simplicity increases without managing dividend distributions.
The Ireland domicile enhances tax efficiency. The UCITS structure provides favorable withholding tax treaties with source countries. Ireland maintains advantageous agreements reducing tax leakage on dividends. Consequently, investors benefit from optimized after-tax returns compared to funds domiciled in less favorable jurisdictions. European investors particularly value UCITS compliance and protections.
Strategic Allocation Considerations
When to Choose VWCE
VWCE suits investors seeking single-fund simplicity. The all-world approach eliminates rebalancing requirements. Moreover, new investors benefit from automatic diversification across developed and emerging markets. Monthly investment plans work efficiently with one purchase transaction. Notably, the expense ratio remains competitive despite comprehensive global coverage.
Use the rebalance-cost analyzer to find the rebalance-trigger threshold that minimises taxable events.
Conservative investors appreciate VWCE’s stability. The developed market majority provides downside protection during emerging market volatility. Furthermore, technology leadership through US holdings captures innovation trends. The 10-12% emerging market allocation adds growth without excessive risk. In short, this balance appeals to investors with moderate risk tolerance seeking global exposure.
When to Select EMIM or IEMA
EMIM targets investors wanting comprehensive emerging market coverage. The inclusion of small-cap stocks increases growth potential through exposure to emerging companies. Additionally, investors with existing developed market holdings can add EMIM for balanced global exposure. The 0.18% expense ratio provides cost-effective access to 3,243 emerging market stocks.
IEMA appeals to conservative emerging market investors. The focus on large and mid-cap stocks reduces small-cap volatility. Established companies offer greater financial stability and liquidity. Therefore, investors concerned about emerging market risks may prefer IEMA’s quality-oriented approach. In practice, the fund works well when paired with developed market core holdings.
Market Outlook and Future Considerations
Emerging Markets Resurgence
Current valuations favor emerging markets. These economies trade at approximately 50% discount to developed markets based on price-to-book ratios. Notably, this represents the largest discount ever recorded. Emerging markets are projected to contribute 65% of global economic growth in coming years. Moreover, improving balance sheets and easing inflation support accommodative monetary policies.
Currency dynamics influence returns significantly. US dollar weakness historically correlates with emerging market outperformance. For example, each 1% dollar decline typically boosts emerging market returns by approximately 4%. Current economic conditions suggest potential dollar weakness ahead. Consequently, investors should monitor currency trends when evaluating emerging market positions.
Geopolitical and Economic Factors
Political stability varies significantly across emerging economies. India demonstrates strong growth projections supported by favorable demographics. By contrast, Taiwan faces geopolitical tensions despite leading semiconductor technology. China implements policy pivots affecting market sentiment. Additionally, Brazil navigates fiscal challenges and monetary policy adjustments.
Regulatory environments continue evolving. Chinese government crackdowns on technology and gaming sectors create uncertainty. By contrast, Indian market reforms improve investor protection and transparency. Moreover, Southeast Asian nations benefit from supply chain diversification away from China. Therefore, investors must assess country-specific risks when evaluating emerging market exposure.
Practical Implementation Strategies
Portfolio Construction Approaches
Single-fund investors should consider VWCE exclusively. This approach maximizes simplicity while providing global diversification. Importantly, the automatic rebalancing maintains target allocations without investor intervention. Monthly contributions build positions efficiently with one transaction. Consequently, transaction costs remain minimal through consolidated purchases.
Multi-fund portfolios benefit from combining developed and emerging market ETFs. Pairing a developed market fund with EMIM or IEMA allows customized allocation control. For example, an 88/12 split between developed and emerging markets mirrors global capitalization weights. Investors can adjust weightings based on market conditions and personal risk tolerance. However, this flexibility comes at the cost of periodic rebalancing requirements.
Rebalancing and Maintenance
VWCE eliminates rebalancing needs. The fund provider maintains target allocations automatically through purchases and sales. Consequently, investors avoid transaction costs and tax implications from rebalancing. In practice, this hands-off approach suits busy professionals and those preferring passive management. The accumulating structure further reduces administrative burden.
Combined strategies require periodic rebalancing. Emerging market outperformance or underperformance shifts portfolio allocations away from targets. Therefore, investors must sell outperformers and buy underperformers to maintain desired weightings. Annual or semi-annual rebalancing typically suffices. Importantly, transaction costs and tax implications should factor into rebalancing frequency decisions.
Final Verdict and Recommendations
VWCE excels for simplicity-focused investors. The single-fund solution provides comprehensive global exposure without complexity. Moreover, automatic dividend reinvestment and rebalancing reduce maintenance requirements. The competitive expense ratio justifies the all-in-one convenience. In short, new investors and those prioritizing ease of management should strongly consider VWCE.
EMIM offers superior emerging market coverage. The inclusion of small-cap stocks provides exposure to the entire investable universe. Additionally, investors with existing developed market holdings can add EMIM for complete global coverage. The 0.18% expense ratio delivers excellent value for comprehensive emerging market access. Therefore, this fund suits experienced investors comfortable with higher volatility.
IEMA provides quality-focused emerging market exposure. The emphasis on large and mid-cap stocks reduces risk while maintaining growth potential. By contrast, conservative investors concerned about small-cap volatility may prefer IEMA’s approach. In practice, the fund works well as a satellite position complementing core developed market holdings. Notably, risk-adjusted returns potentially improve through focus on established companies.
Market conditions favor emerging market allocations currently. Record valuation discounts create compelling entry points for long-term investors. Moreover, improving economic fundamentals support sustained growth. Currency dynamics may provide additional tailwinds. Importantly, investors should evaluate their risk tolerance and time horizon when determining appropriate allocation levels. Consequently, diversification across these funds or strategic selection based on investment goals positions portfolios for success across market cycles.
UCITS Structure, Domicile and Withholding Tax for European Investors
All three funds – VWCE, EMIM and IEMA – are Irish-domiciled UCITS ETFs. This is the standard wrapper for European retail investors. The UCITS regime is harmonised at EU level by ESMA. National regulators supervise member states. For example, BaFin oversees Germany and CySEC oversees Cyprus. Importantly, UCITS rules cap concentration (the 5/10/40 rule), require depositary oversight, and force daily NAV disclosure. Consequently, all of these features materially reduce structural risk versus non-UCITS funds.
Ireland’s network of double-tax treaties typically reduces US withholding tax on dividends inside the fund to 15%. By contrast, a Luxembourg or non-treaty domicile faces 30% on US source income. For emerging-market dividends the picture is more fragmented. Withholding rates vary by source country. Moreover, the headline tax drag inside EMIM and IEMA is generally a few basis points higher than for a pure developed-market MSCI World ETF. Notably, the official KIDs and annual reports published on iShares.com and Vanguard’s product page disclose this in detail.
EMIM vs IEMA: Why Two Almost-Identical iShares ETFs Exist
EMIM and IEMA are both BlackRock iShares funds tracking emerging-market indices. Both share the same headline expense ratio and accumulating structure. However, the single material difference is the index family:
- EMIM tracks the MSCI Emerging Markets IMI (Investable Market Index), covering large, mid and small-cap names – approximately 3,243 holdings representing ~99% of EM free-float market cap.
- IEMA tracks the standard MSCI Emerging Markets index – large and mid-cap only, around 1,051 holdings representing ~85% of EM free-float market cap.
For most long-horizon investors the realised return difference between the IMI and standard variants is small over multi-year periods. This is because the small-cap sleeve is a minority of EM market cap. However, the IMI version (EMIM) is the strictly more diversified instrument. It is the default pick if you want maximum breadth without overpaying. Notably, live profile data is published on justETF and methodology audits appear on Morningstar UK.
How VWCE Allocates to Emerging Markets Under the Hood
VWCE follows FTSE All-World, which treats South Korea as a developed market. This methodology choice differs from MSCI’s classification, which still treats Korea as emerging. Consequently, that single difference partially explains why VWCE’s effective emerging-market weight sits around 10-12% rather than the headline ~13% implied by MSCI ACWI. The full FTSE All-World methodology is documented in the index ground rules linked from Vanguard’s VWCE product page.
If you already hold VWCE as a one-fund core, layering EMIM or IEMA on top is the standard way to tilt your portfolio further toward EM without abandoning a single-fund foundation. However, the trade-off is added complexity. You must rebalance manually. Additionally, you create overlap with VWCE’s existing EM sleeve. For portfolio construction principles, see the Bogleheads wiki on three-fund portfolios. This informs how we frame core-satellite allocation on this site.
Practical Broker and Execution Notes
All three ETFs trade actively on Xetra, Borsa Italiana, SIX, and Euronext. Secondary venues at Tradegate and gettex operate during German hours. Typical retail bid-ask spreads sit in the 2-7 basis point range during core hours. Notably, VWCE and EMIM show the tightest spreads thanks to roughly EUR 27 billion of assets each. By contrast, IEMA is around EUR 6 billion, still ample for retail. For broker selection criteria see our European ETF brokers hub. Moreover, for a beginner-friendly walkthrough start with the European ETF investing beginner roadmap.
Frequently Asked Questions
Is VWCE enough on its own, or do I need EMIM or IEMA on top?
For most long-horizon investors VWCE is enough as a one-fund global core. It already holds ~10-12% emerging markets via the FTSE All-World index. However, adding EMIM or IEMA only makes sense if you deliberately want to overweight emerging markets above market-cap weights. In short, this is a strategic tilt rather than a diversification fix.
What is the practical difference between EMIM and IEMA?
EMIM tracks MSCI Emerging Markets IMI and includes small-cap stocks (~3,243 holdings). By contrast, IEMA tracks the standard MSCI Emerging Markets index with large and mid-caps only (~1,051 holdings). Both charge 0.18% TER, are accumulating, and Irish-domiciled. In short, EMIM is broader; IEMA is more concentrated in established EM names.
Why is South Korea sometimes treated as emerging and sometimes as developed?
FTSE (which underpins VWCE) classifies South Korea as developed. By contrast, MSCI (which underpins EMIM and IEMA) still classifies South Korea as emerging. Consequently, this methodology difference means EMIM and IEMA include Samsung Electronics in their EM exposure. Meanwhile, VWCE places Samsung in the developed-market sleeve. Importantly, neither approach is wrong; they reflect different index providers’ criteria.
Are EMIM and IEMA tax-efficient for German investors?
Both qualify for the 30% Teilfreistellung under InvStG 2018 because they hold more than 51% in listed equities. Consequently, the effective Abgeltungsteuer drops to roughly 17.5% on net gains. Moreover, the accumulating structure defers tax via the annual Vorabpauschale rather than triggering it on every distribution. Importantly, confirm jurisdiction-specific treatment with a qualified tax adviser. This article is general education, not personal tax advice.
How do I buy VWCE, EMIM or IEMA from a European brokerage?
All three trade on Xetra and most Pan-European venues. Discount brokers such as Interactive Brokers, Trade Republic, XTB and Freedom24 route UCITS ETF orders through these venues with low commission. In practice, use limit orders during European core hours (09:00-17:30 CET) for tighter execution. See our European ETF brokers hub for current side-by-side comparisons.
What are the ISINs for VWCE, EMIM and IEMA?
VWCE: IE00BK5BQT80 (Vanguard FTSE All-World UCITS ETF, USD accumulating). EMIM: IE00BKM4GZ66 (iShares Core MSCI EM IMI UCITS ETF, USD accumulating). IEMA: IE00B4L5YC18 (iShares MSCI Emerging Markets UCITS ETF, USD accumulating). Importantly, always confirm the ISIN on the official KID before trading, since ticker symbols vary by exchange.
How concentrated is Taiwan Semiconductor in EMIM and IEMA?
TSMC is the largest single holding in both ETFs. It sits in the 8-12% range depending on the publication date and source. Notably, that concentration is a function of MSCI’s free-float weighting methodology. TSMC dominates Taiwan’s market cap. Moreover, Taiwan is among the largest country weights in the EM index. Importantly, the risk is real: a single semiconductor company and a single geopolitical flashpoint together drive a meaningful share of returns.
Sources and further reading
- justETF — European UCITS ETF screener
- Morningstar UK ETF rankings
- ESMA — European Securities and Markets Authority
- Bogleheads wiki — EU investing
- ETF.com industry data
European UCITS/ETF investor with 11+ years building a global dividend and index portfolio, and founder of Financial Expert Class. I write every guide here from first-hand experience investing across EU brokers and tax regimes — not theory. More about me →